


Following the release of the latest earnings reports from the leading Big Tech companies, we decided to take stock of the situation and understand what is really changing across their businesses and, above all, how their investments in artificial intelligence are evolving.
Over the past two years, the AI–infrastructure equation has become one of the main lenses through which to assess these companies’ results. Investments in data centers, accelerators, proprietary chips, and compute capacity have reached unprecedented levels, but the latest earnings reports are making one thing increasingly clear: what matters is not only how much capital is being invested, but how quickly that capacity can translate into utilization, revenue, margins, and cash generation.
We start with Microsoft, Alphabet, and Amazon, the three companies most directly exposed to competition in the cloud. Azure, Google Cloud, and AWS are all going through a period of strong acceleration, supported by growing demand for AI-related compute capacity.
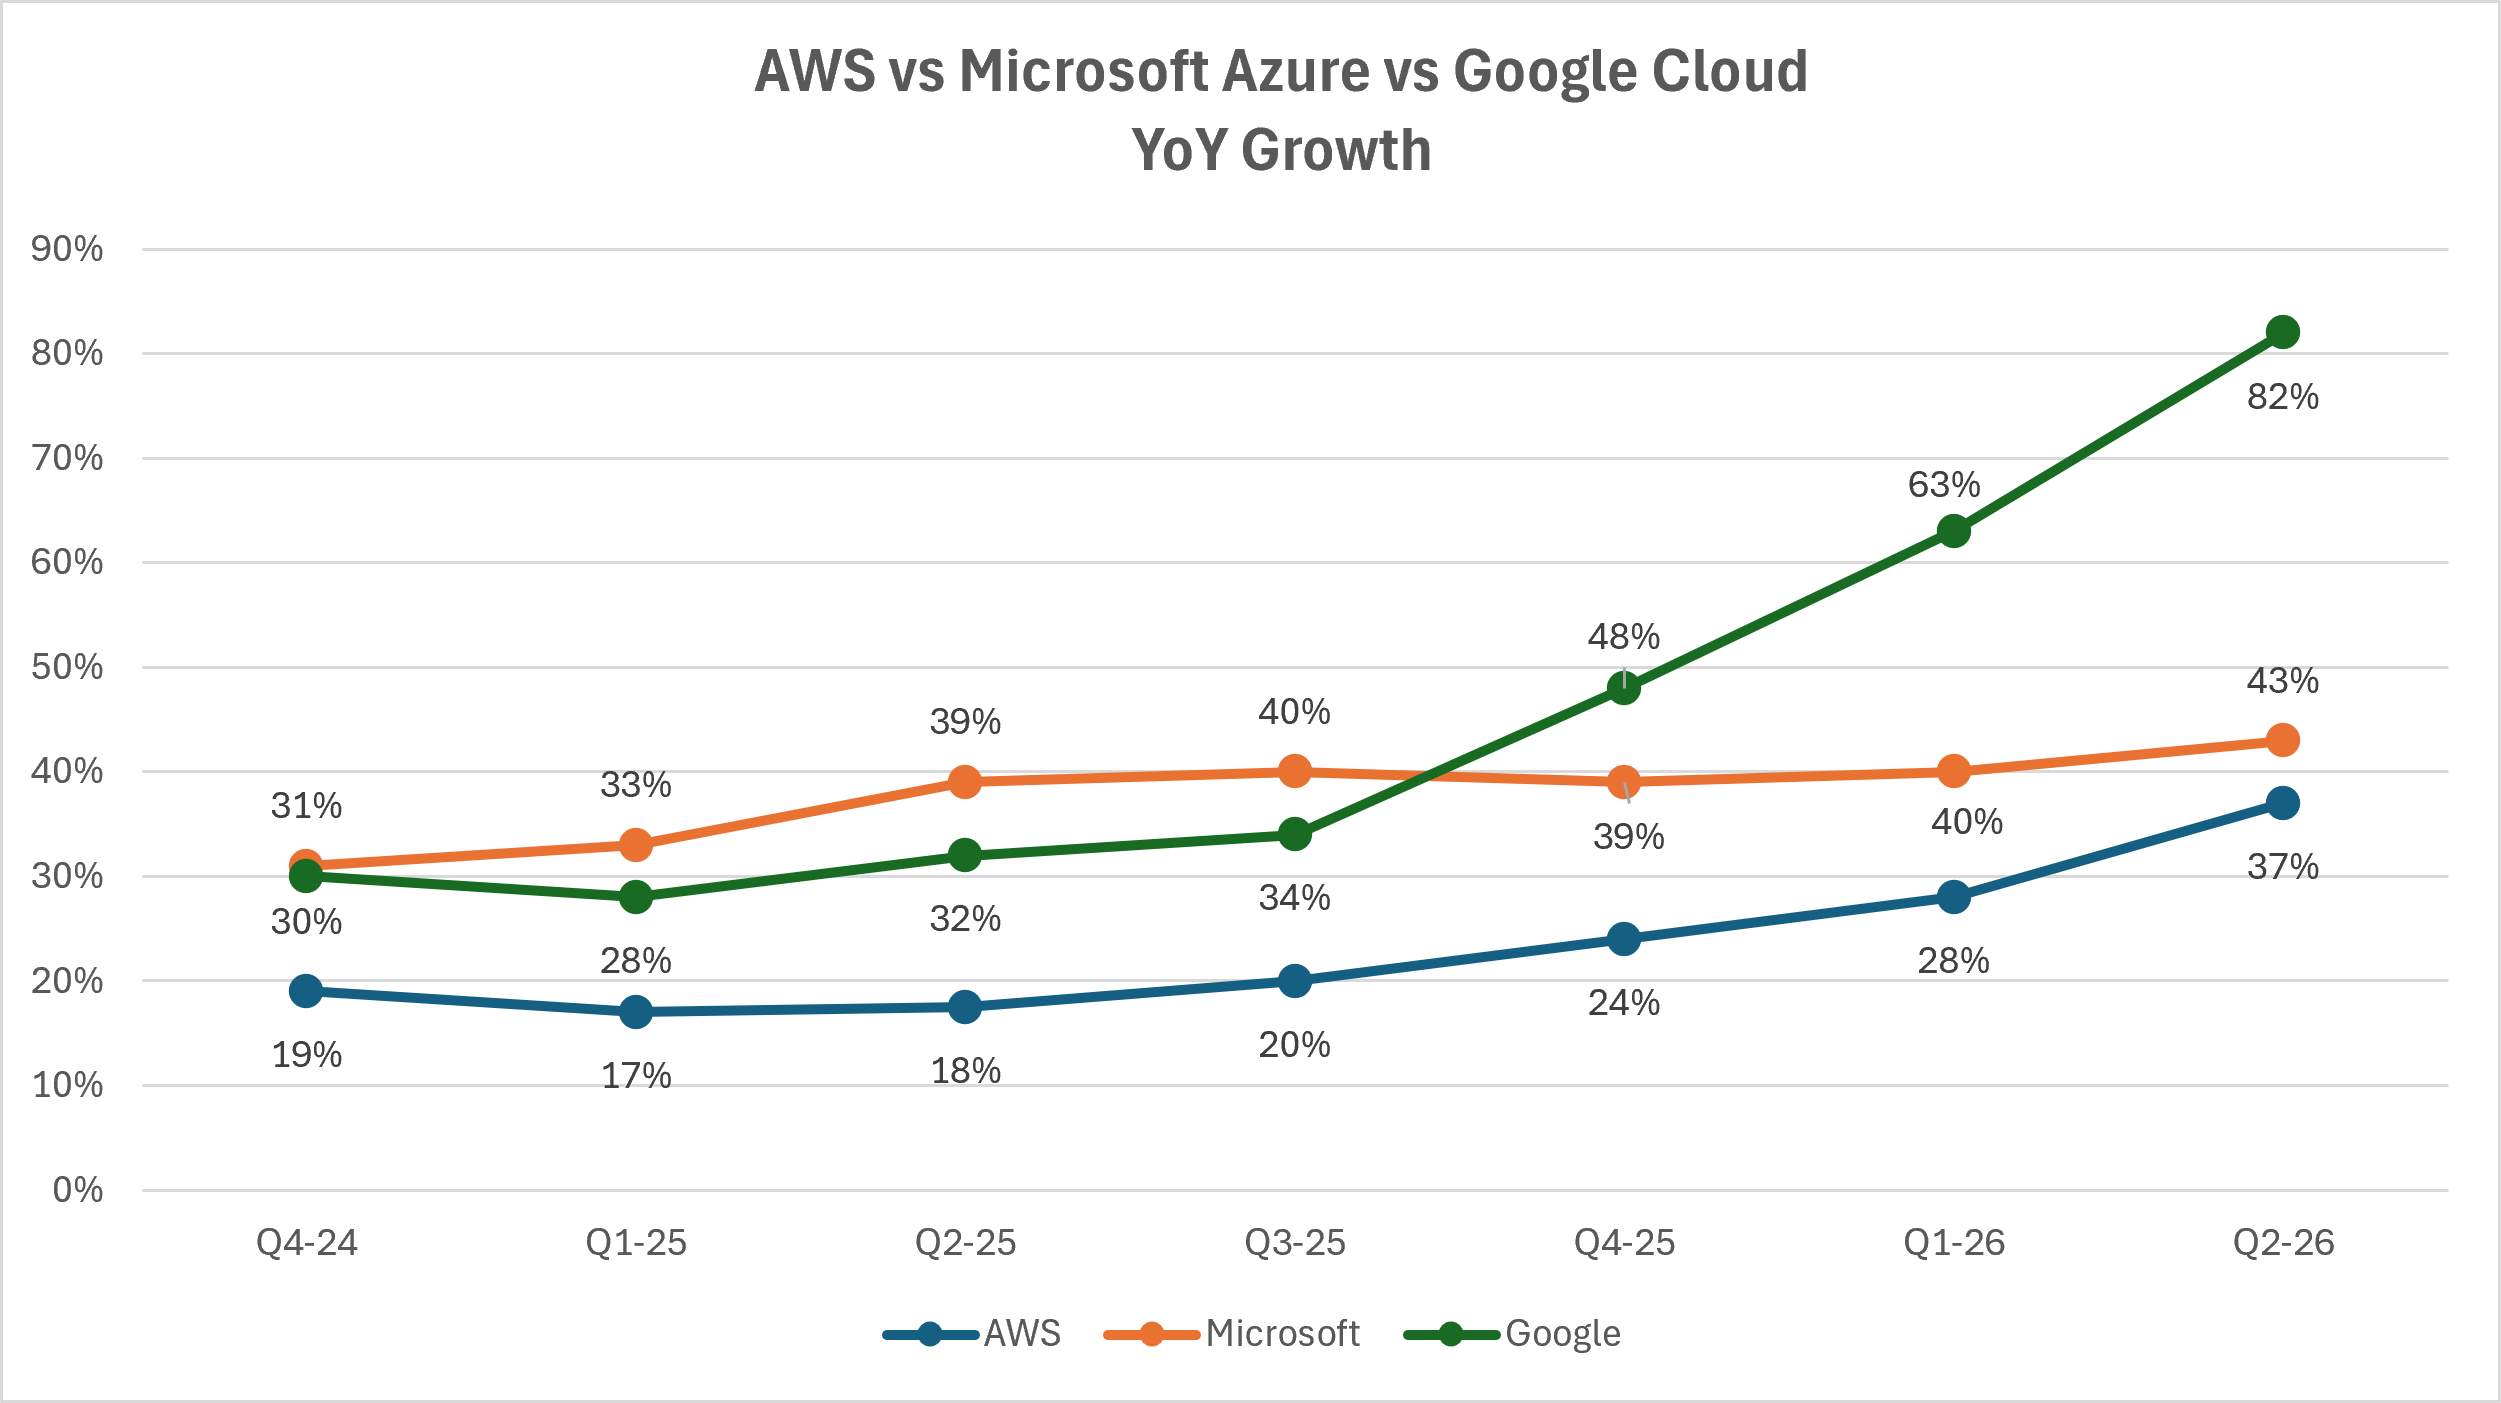
The chart clearly shows just how pronounced this acceleration has become. In the most recent quarter, AWS grew 37%, Azure 43%, and Google Cloud 82%, although the latter figure was partly boosted by the first sales of TPU systems directly to customers and is therefore not perfectly comparable with the other two. The direction, however, is the same: demand for cloud and AI infrastructure continues to grow rapidly and, in many cases, the main constraint on expansion is no longer finding customers, but building enough capacity to meet demand.
This is precisely where the differences among the three companies become particularly interesting. Amazon, Alphabet, and Microsoft are all investing heavily, but with very different effects on free cash flow, margins, and capital structure. For now, Microsoft continues to fund its expansion while maintaining strong cash generation; Amazon is front-loading very large investments that are temporarily compressing free cash flow; Alphabet, despite Google Cloud’s exceptional growth, has begun relying more significantly on both debt and equity to sustain the pace of expansion.
After these three companies, we will turn to Meta and Apple, two cases that are less directly comparable with the hyperscalers but are equally important for understanding the sector’s current phase. Meta is investing enormous amounts in AI infrastructure without yet having a major cloud business through which to sell that new capacity directly, while Apple is pursuing a completely different model, much more focused on on-device processing and on integrating artificial intelligence into the iPhone and its broader ecosystem.
The purpose of this update is therefore not simply to determine which company reported the “best” quarter, but to capture where each Big Tech company stands today: where growth is coming from, how much it costs to sustain, which investments are already generating visible returns, and which will require more time before they can be properly assessed.
Microsoft: the most complete monetization model
Microsoft has provided one of the most compelling demonstrations that the current cycle of investment in artificial intelligence can translate into tangible growth, recurring monetization, and cash generation. The market reacted strongly: in the session following the earnings release, the stock gained around 15% at the Wall Street open, marking its largest intraday rise in the past six years.
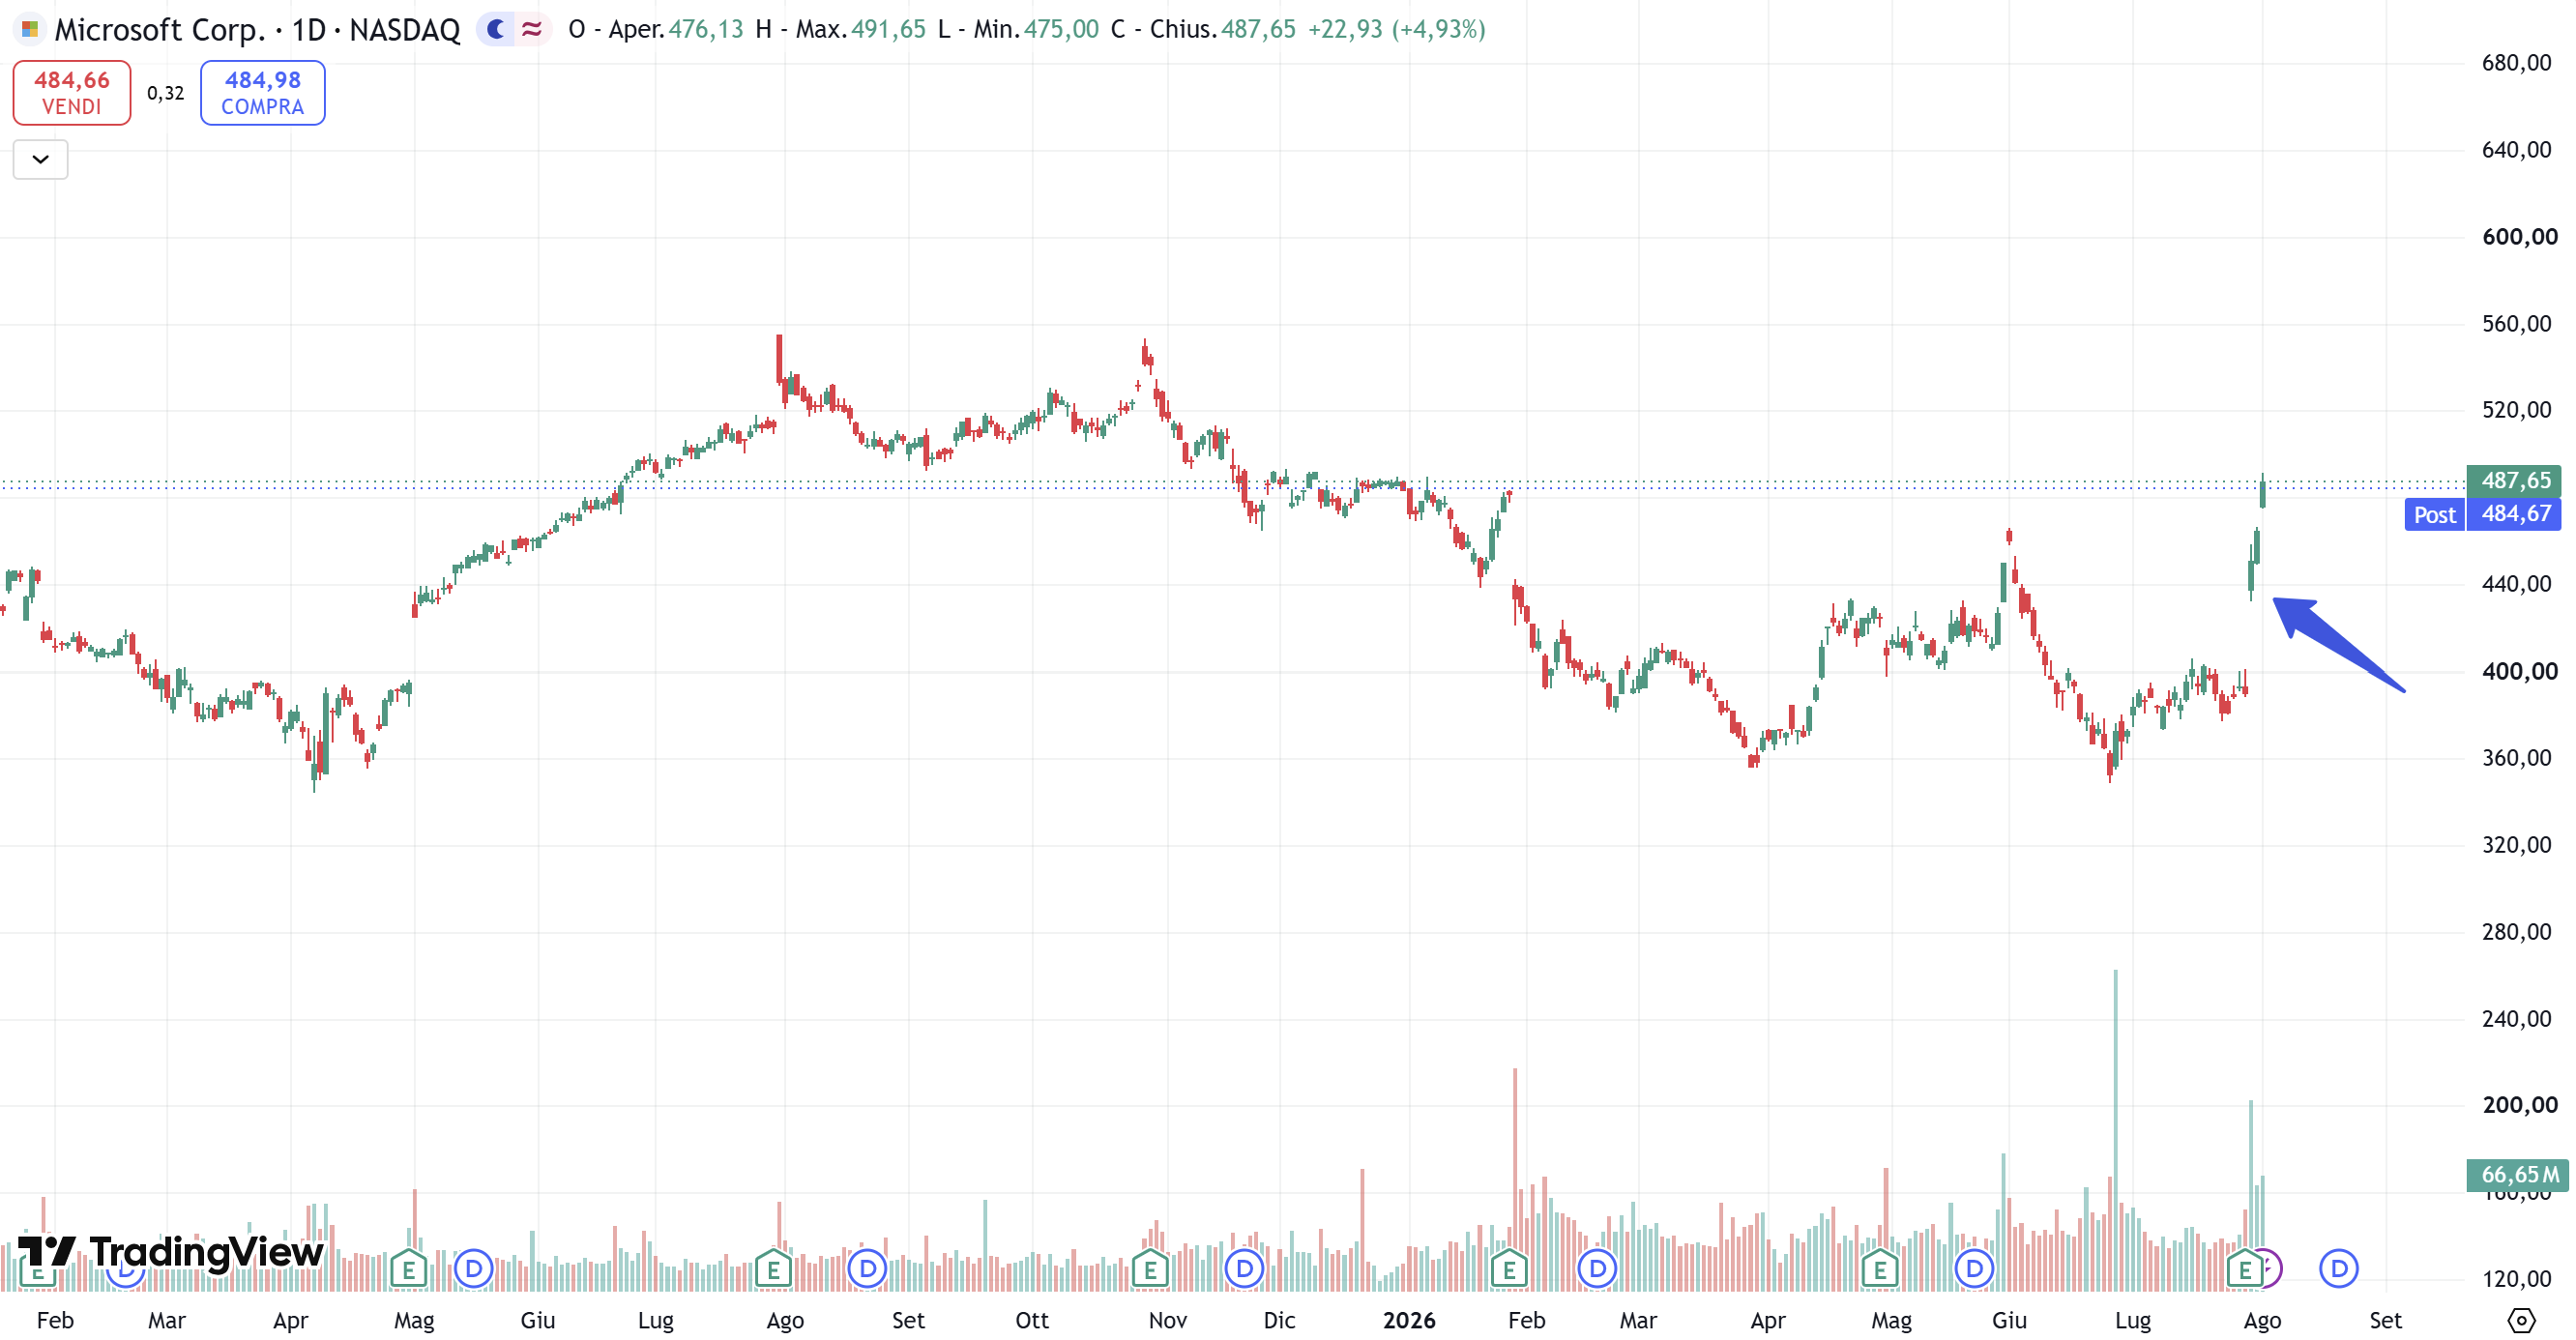
The reaction is particularly significant because Microsoft was rewarded despite an exceptionally high level of investment: investors recognized that the new infrastructure capacity is being absorbed rapidly and is already generating incremental revenue.
Azure grew 43% in the fiscal fourth quarter, accelerating from 40% in the previous period and exceeding the roughly 40% growth rate expected by the market. Management expects further acceleration to around 45% in the current quarter, while demand continues to exceed available capacity. For the full fiscal year, Azure surpassed $100 billion in revenue for the first time, while Microsoft Cloud reached $214 billion for the year and $59.3 billion in the quarter alone, up 27%.
This point is crucial: the main constraint on growth is not a lack of customers, but the amount of compute capacity Microsoft can bring online.
CFO Amy Hood emphasized that the capacity additions delivered during the quarter were monetized almost immediately, confirming that the company is not building infrastructure ahead of demand, but rather trying to close an existing gap between available supply and customer demand.
During the quarter alone, Microsoft brought 31 new data centers online across five continents, bringing the total number of new facilities opened during the fiscal year to 88. The company also added approximately one gigawatt of capacity during the period and remains on track to roughly double its overall capacity over a two-year period. At the same time, in its most important regions, the time required to move new GPUs from delivery to actual production deployment has been reduced by nearly 50%.
These improvements have a direct economic impact. In an environment where demand exceeds supply, reducing deployment times means bringing forward revenue recognition, increasing asset utilization, and shortening the time required to earn a return on invested capital.
Microsoft is also increasing the returns generated by its existing infrastructure. Since the beginning of the year, throughput for Copilot workloads has quadrupled, allowing the company to process a much larger volume of requests on the same infrastructure base. Its proprietary Maia 200 chip also delivers 30% better performance per dollar than previous-generation hardware in the fleet and, when used with Microsoft’s proprietary MAI models, provides a 40% improvement in performance per watt.
Returns on CapEx therefore do not depend solely on volume growth or potential price increases. Microsoft can also improve ROIC through greater utilization of existing capacity, the adoption of proprietary chips, the use of lower-cost models, better efficiency per token, and shorter deployment times for new infrastructure. These factors help reduce the unit cost of inference and provide meaningful support for margins over time.
Monetization is also not limited to the infrastructure layer. Microsoft 365 Copilot has surpassed 30 million paid licenses, up from around 20 million just three months earlier, with net new activations more than doubling sequentially.
Adoption is also becoming deeper, not just broader. The number of customers with more than 50,000 Copilot licenses has increased more than sevenfold year over year, while the number of companies that have deployed the product to the majority of their information workers has grown by around 75% from the previous quarter. The time required to reach high levels of usage has fallen from several months to just a few days, while the number of conversations per user has nearly doubled year over year. According to management, average weekly engagement is now comparable with established products such as Outlook and Teams.
Microsoft is therefore able to monetize artificial intelligence across several complementary layers:
Azure capacity consumption;
recurring software licenses;
per-user billing;
models based on usage intensity;
increasing the average value of enterprise suites through premium products such as Copilot, E5, and E7.
The commercial model is in fact evolving from a pure per-user licensing structure to a combination of licensing and consumption-based billing. This allows the group to monetize both the expansion of its customer base and the increase in usage intensity. The shift is already visible in GitHub Copilot, whose revenue growth accelerated by more than 60% sequentially following the introduction of pricing more closely linked to consumption and value generated.
The quality of demand also appears particularly strong. Commercial Remaining Performance Obligations reached $678 billion, up 84%, and increased 25% even excluding OpenAI. All of the sequential increase in RPO was generated by customers other than the leading frontier model developers, while nearly 90% of Microsoft Cloud’s annual revenue comes from customers outside this category.
This reduces the risk that growth is overly dependent on a small number of large AI labs or on potentially circular commercial relationships between hyperscalers and model developers. Instead, demand is spreading across different industries, geographies, and customer types, strengthening visibility into future revenue.
Quarterly CapEx increased 70% to $41 billion, but Microsoft continues to fund most of its expansion program internally. During the quarter, operating cash flow rose 30% to $55.4 billion, allowing the company to generate $19.6 billion of free cash flow despite the exceptional level of investment. Consolidated operating margin remained around 45%, while Microsoft Cloud gross margin, despite the greater weight of Azure and the costs associated with AI infrastructure, came in better than expected at 65%.
Around two-thirds of CapEx was allocated to assets with relatively short economic lives, primarily CPUs and GPUs, while the remaining share was directed toward longer-lived assets such as land, buildings, and data center infrastructure. This mix gives the company a meaningful degree of flexibility: if demand were to slow, Microsoft could reduce or defer processor purchases, which represent the largest and most adjustable component of the program, without giving up the strategic investments already made in real estate and network infrastructure.
Beginning in fiscal 2027, Microsoft will also extend the estimated useful accounting life of data centers and office buildings from 15 to 25 years, reflecting the observed and expected period of use for these assets. According to management, the benefit to 2027 operating income will be minimal; the more significant effect will instead relate to lease classification.
A larger share of future data center contracts will be accounted for as operating leases rather than finance leases. Because finance leases are included in reported CapEx while operating leases are excluded, this change has brought the company’s projected calendar-year 2026 CapEx to approximately $175 billion. Microsoft has nevertheless clarified that, excluding the accounting reclassification, expectations for actual economic investment remain broadly unchanged.
A future slowdown in reported CapEx should therefore not automatically be interpreted as a reduction in infrastructure expansion. Part of the change will simply reflect the shift from finance leases to operating leases, with a larger share of the cost progressively appearing in operating cash flows and future contractual obligations.
Microsoft therefore represents the case in which the economic chain of AI investment currently appears the most complete:
CapEx → capacity brought online → Azure consumption → software licenses and usage-based revenue → positive free cash flow.
The company is not simply building infrastructure; it is reducing the time required to make that infrastructure productive, increasing the efficiency of existing capacity, and introducing commercial models that allow it to monetize both the number of users and the intensity of usage. The growth in backlog outside the major model developers also shows that demand is broadening across the enterprise market.
As long as Microsoft continues to fund its expansion primarily through its own cash generation while preserving high margins and positive free cash flow, its CapEx program should continue to be viewed by the market as a productive investment already in the process of being monetized, rather than simply a promise of future returns.
Alphabet: exceptional cloud growth, but a more aggressive financing strategy
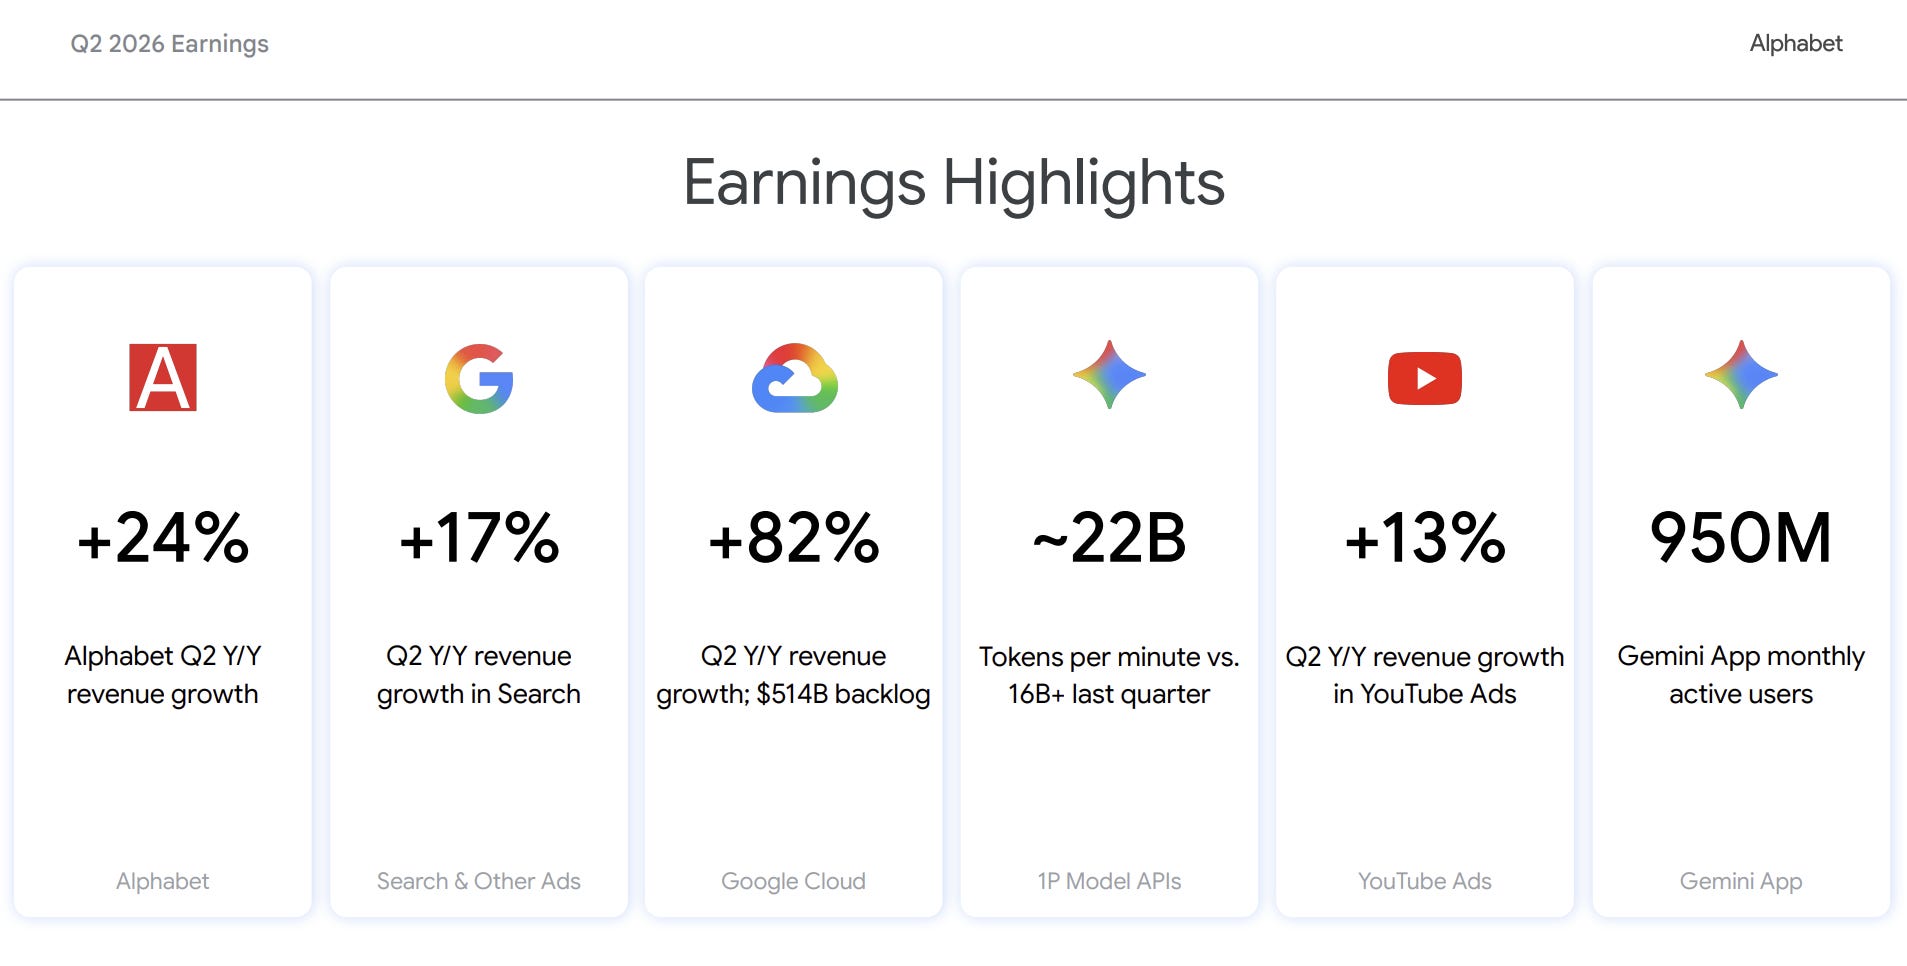
Alphabet delivered exceptionally strong operating results. Consolidated revenue increased 24% to $119.8 billion, while Google Cloud accelerated by 82%, reaching $24.8 billion.
More importantly, that growth was accompanied by a significant improvement in profitability. Google Cloud operating income rose from $2.8 billion to $8.8 billion, bringing the segment’s operating margin close to 36%. The increase was driven by demand for AI infrastructure, enterprise solutions, and core Google Cloud Platform services.
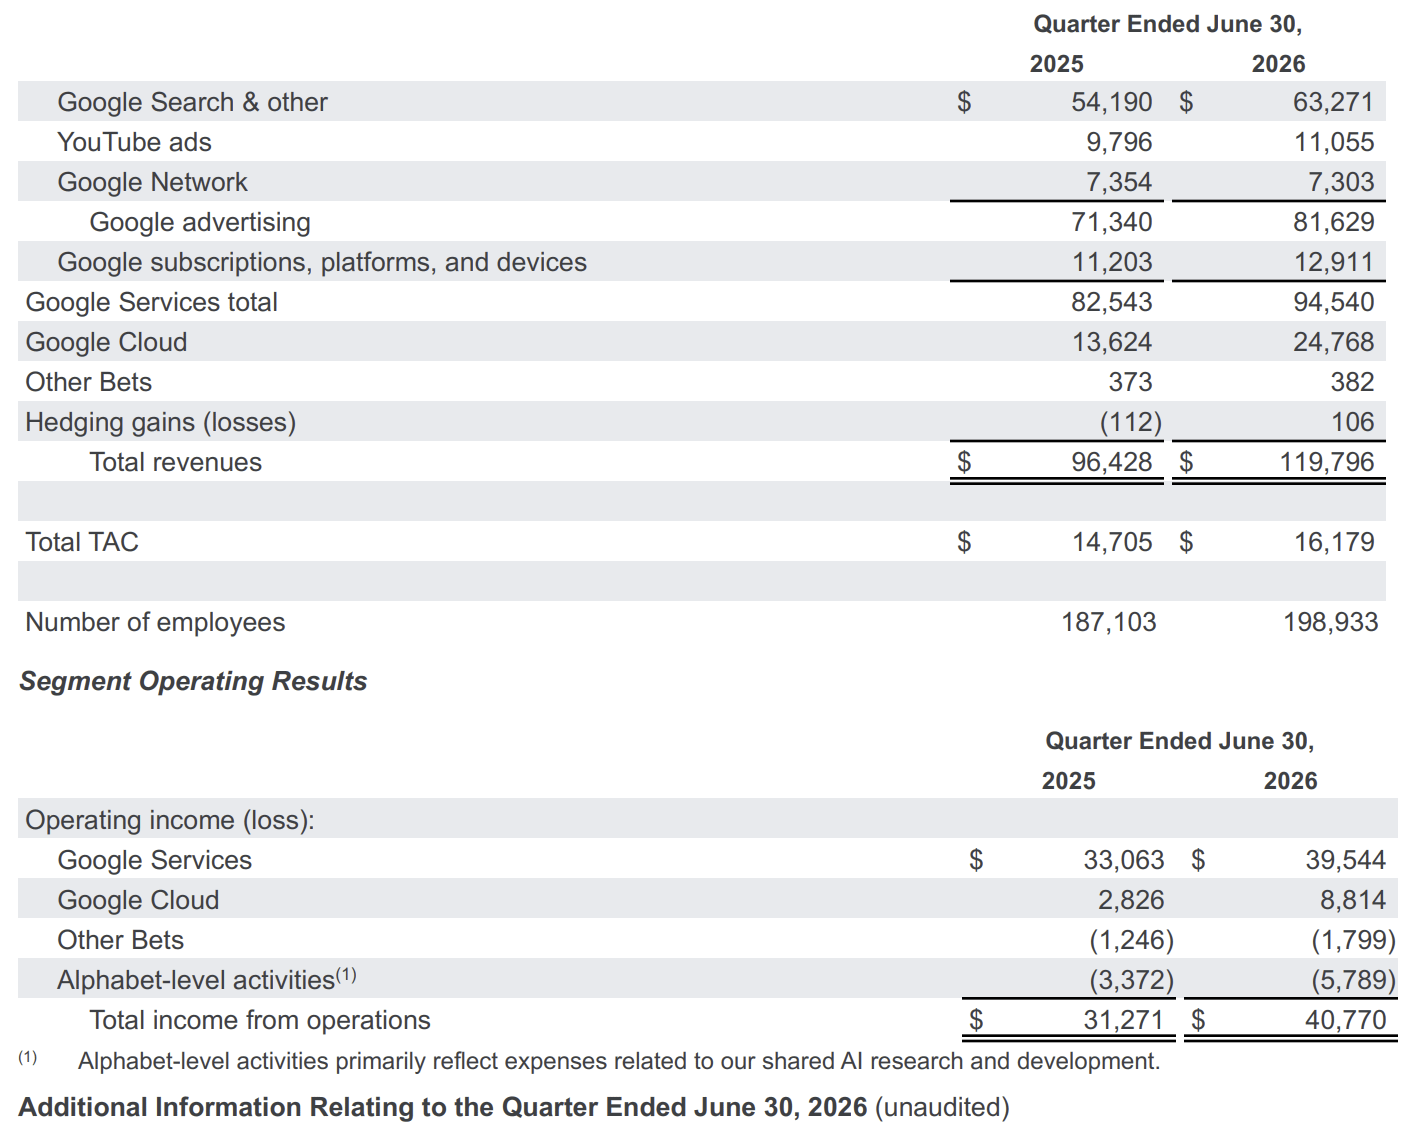
Part of the quarter’s growth came from the first sales of TPU systems installed directly in customers’ data centers. Management nevertheless clarified that Google Cloud would have posted a significant acceleration even excluding this contribution, while GCP grew at a faster rate than the overall Cloud segment. TPU sales therefore expand Alphabet’s addressable market, but they make the comparison with Azure and AWS slightly less like-for-like. The majority of the revenue related to agreements already signed is also expected to be recognized in 2027 rather than in the quarter just ended.
Visibility into future revenue also improved significantly. Google Cloud backlog increased by more than $50 billion sequentially to $514 billion, and management expects just over half of that amount to be converted into revenue over the next 24 months. Most of the backlog relates to standard GCP contracts signed with a broad customer base rather than to TPU system sales alone. The pace of new customer acquisition has more than doubled year over year, while existing customers are exceeding their contractual commitments by more than 50%. Transactions through Google Cloud Marketplace have also increased more than sevenfold.
Enterprise adoption further confirms that demand is not concentrated solely among a small number of large model developers. Nearly 90% of Fortune 100 companies use Gemini Enterprise, while around 500 Cloud customers have each processed more than one trillion tokens over the past 12 months and more than 2,000 companies have exceeded 100 billion tokens. Overall, Gemini model APIs are now processing around 22 billion tokens per minute, up from 16 billion in the previous quarter.
The increase in consumption, combined with the fact that Alphabet remains constrained by available capacity, indicates that infrastructure expansion is responding to already observable usage rather than to a purely speculative forecast of future demand.
The traditional advertising business also maintained solid momentum: Search grew 17%, YouTube Ads 13%, and the overall Google Services segment 15%. Gemini-powered features are therefore beginning to support both the cloud business and engagement across consumer products.
The call also provided important signals regarding the risk that artificial intelligence could cannibalize the traditional search business. AI Mode has surpassed 1 billion monthly active users and is driving a net increase in the overall number of queries, while Alphabet continues to report encouraging results in monetizing searches that include AI Overviews. At the same time, the cost of generating a response through AI Mode has fallen to its lowest level since launch, despite the introduction of more advanced features.
Advertiser effectiveness is improving as well. Around 500,000 advertisers have already adopted AI Max and, according to Alphabet, campaigns using AI Max or Performance Max generate on average 15% more conversions or value at the same return on ad spend.
Gemini also makes it possible to understand and monetize longer, more complex queries, including searches that were previously difficult to match with a relevant ad. In other words, AI is not only defending Search against competition: it is expanding the pool of monetizable queries and improving the precision of ad matching.
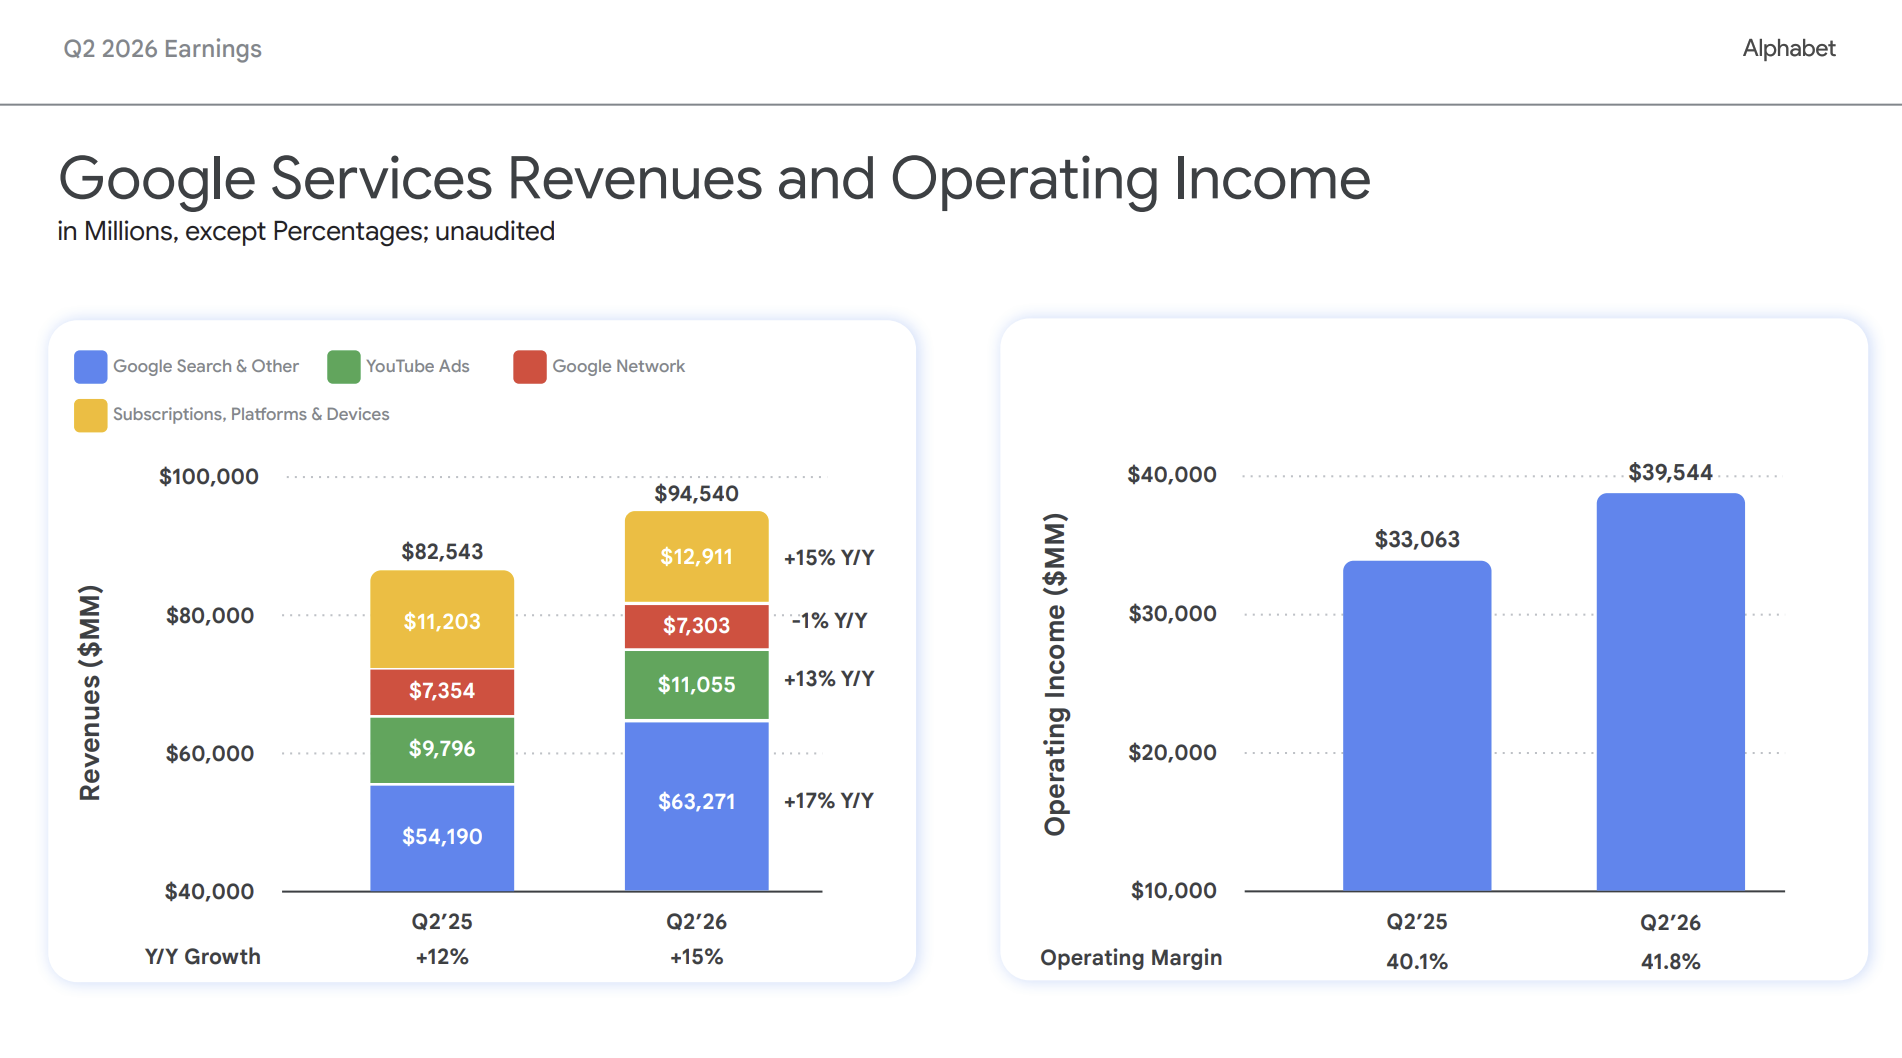
The issue is not demand, but rather the financial intensity required to meet it.
During the quarter, Alphabet generated $39.1 billion in operating cash flow but invested $44.9 billion in property, plant, and equipment, resulting in negative quarterly free cash flow of $5.9 billion. Although free cash flow remained positive at $53.3 billion over the last 12 months, the figure shows how quickly the infrastructure buildout is absorbing the cash generated by the business.
Pressure on cash flow is set to continue. Alphabet raised its 2026 CapEx guidance from $180–190 billion to $195–205 billion and expects another significant increase in 2027.
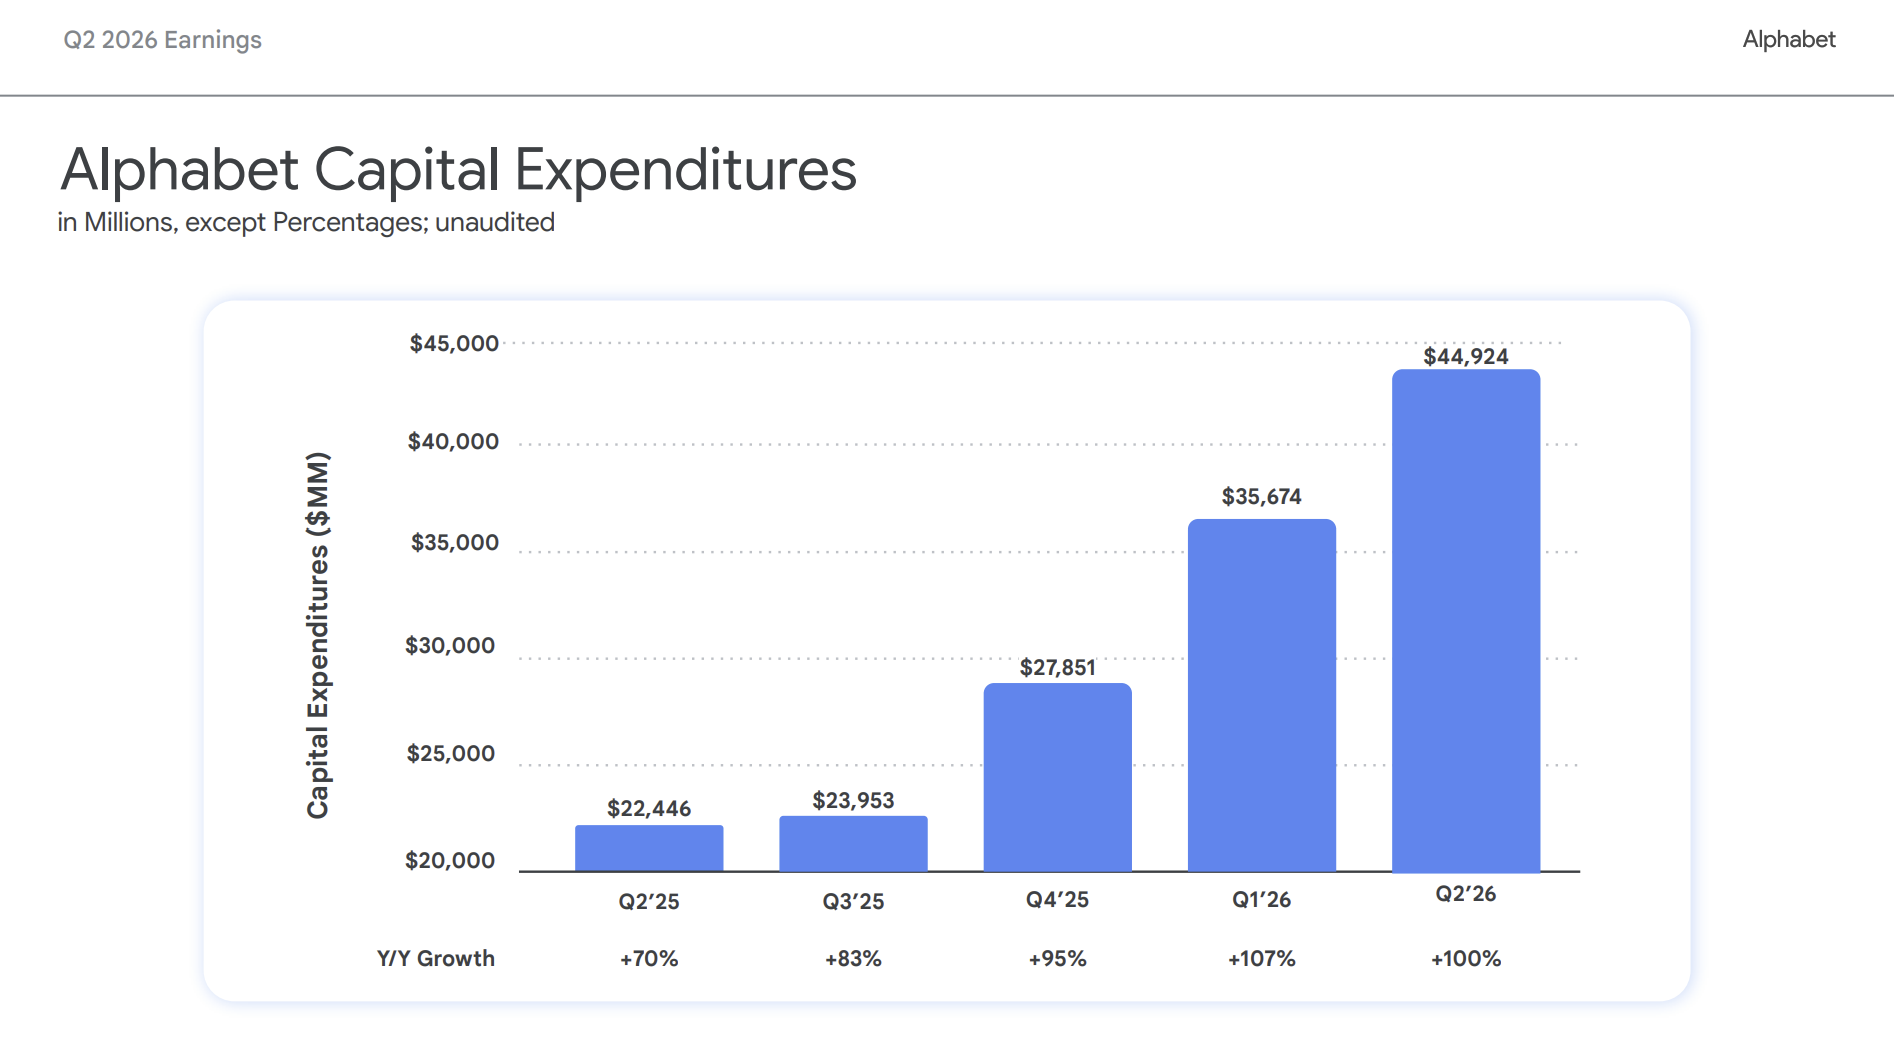
In the second quarter, around 60% of technical infrastructure investment was allocated to servers, while the remaining 40% went to data centers and networking equipment. The expansion in capacity will also lead to a gradual increase in depreciation, power consumption, and the operating costs associated with data centers.
In the near term, however, internal capacity will still not be sufficient to fully meet demand. Alphabet will therefore rely more heavily on third-party infrastructure as a bridge solution, accepting some moderate pressure on Google Cloud margins. Management explained that, for certain large customers, it can make economic sense to absorb higher costs for six months if doing so helps preserve multi-year contracts with very attractive overall returns. Short-term margin pressure would therefore not necessarily imply a deterioration in ROIC over the full duration of the customer relationship.
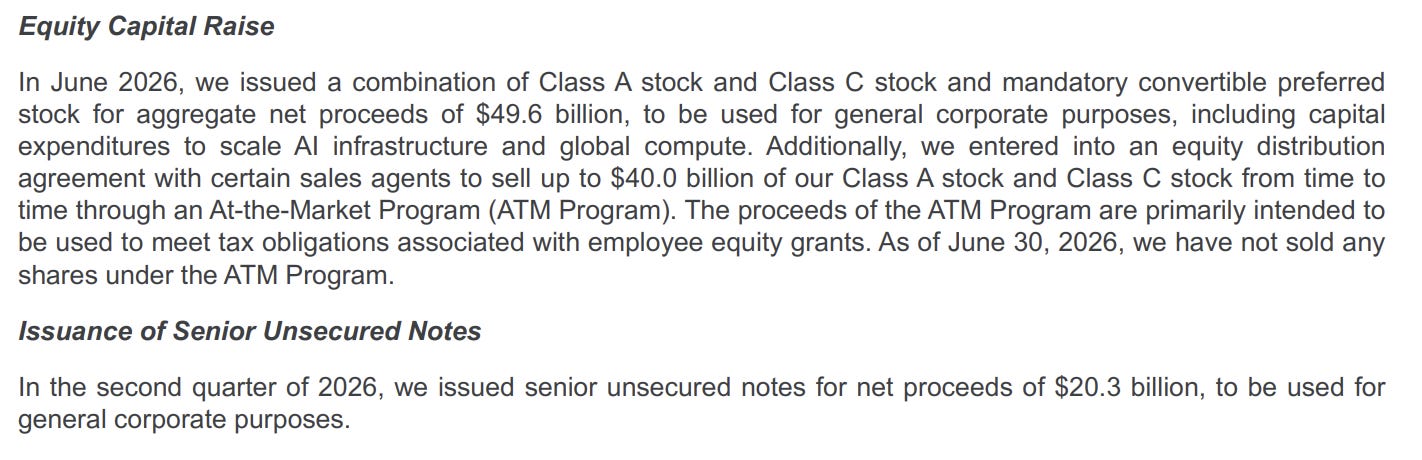
Alphabet has also adopted a particularly aggressive financing strategy. In the second quarter, it raised:
$49.6 billion through common stock and mandatorily convertible preferred shares;
$20.3 billion through senior unsecured notes;
established an ATM program of up to $40 billion, which had not yet been used by the end of the quarter and is intended primarily to cover tax obligations associated with employee stock-based compensation.
During the call, the CFO clarified that Alphabet evaluates its funding sources in a specific order: operating cash flow, debt, and, finally, equity. The use of equity therefore does not reflect a depletion of liquidity—the group ended the quarter with $242.5 billion in cash and marketable securities—but rather a desire to preserve a resilient balance sheet throughout a multi-year investment cycle.
Debt increased from around $16 billion to nearly $100 billion over a 12-month period, making it less attractive to finance the entire funding requirement solely through additional bond issuance. The equity issuance therefore allowed Alphabet to spread the risk across multiple funding sources and preserve greater financial flexibility. At present, management does not expect any further equity issuance beyond the ATM program, which is primarily linked to tax obligations arising from employee stock-based compensation.
This approach protects the group’s liquidity and diversifies its funding sources, but it introduces two costs that the market cannot ignore: shareholder dilution and higher interest expense.
The stock fell by around 7% in the session following the earnings release, despite Google Cloud’s exceptional growth. The reaction did not represent a rejection of Alphabet’s AI strategy, but primarily reflected market concerns over the growing financial intensity of the investment cycle and the need to demonstrate that, over time, a greater share of the expansion can once again be funded through internally generated cash flow.
A superficial reading of the $9.11 GAAP EPS should also be avoided: the figure was heavily influenced by approximately $99 billion in gains on the equity investment portfolio, largely unrealized. Operating performance should therefore be assessed primarily through revenue, margins, and cash flow.
The more accurate interpretation is therefore not that Alphabet still needs to prove it can monetize artificial intelligence. Google Cloud is already converting infrastructure investment into revenue growth, strong margin expansion, and a multi-year backlog, while Search is using Gemini to increase query volumes, improve advertising effectiveness, and expand the pool of monetizable searches.
The real source of uncertainty is the speed at which Alphabet must build new capacity to support this demand. Investment is growing faster than operating cash flow, leading the group to combine internally generated cash, debt, equity, and third-party capacity. Unlike Meta, therefore, Alphabet has already demonstrated a direct link between AI infrastructure and incremental revenue; what the market is questioning is the financial cost required to sustain this acceleration, not the existence of demand or the ability to monetize it.
Amazon: AWS accelerates, free cash flow slows
Amazon delivered one of the most compelling quarters among the Big Tech companies, primarily because the acceleration in investment was accompanied by equally clear signs of monetization. The market reaction was particularly significant: in the session following the earnings release, the stock gained 15.3%, closing at around $272 and moving back close to the highs reached in May.
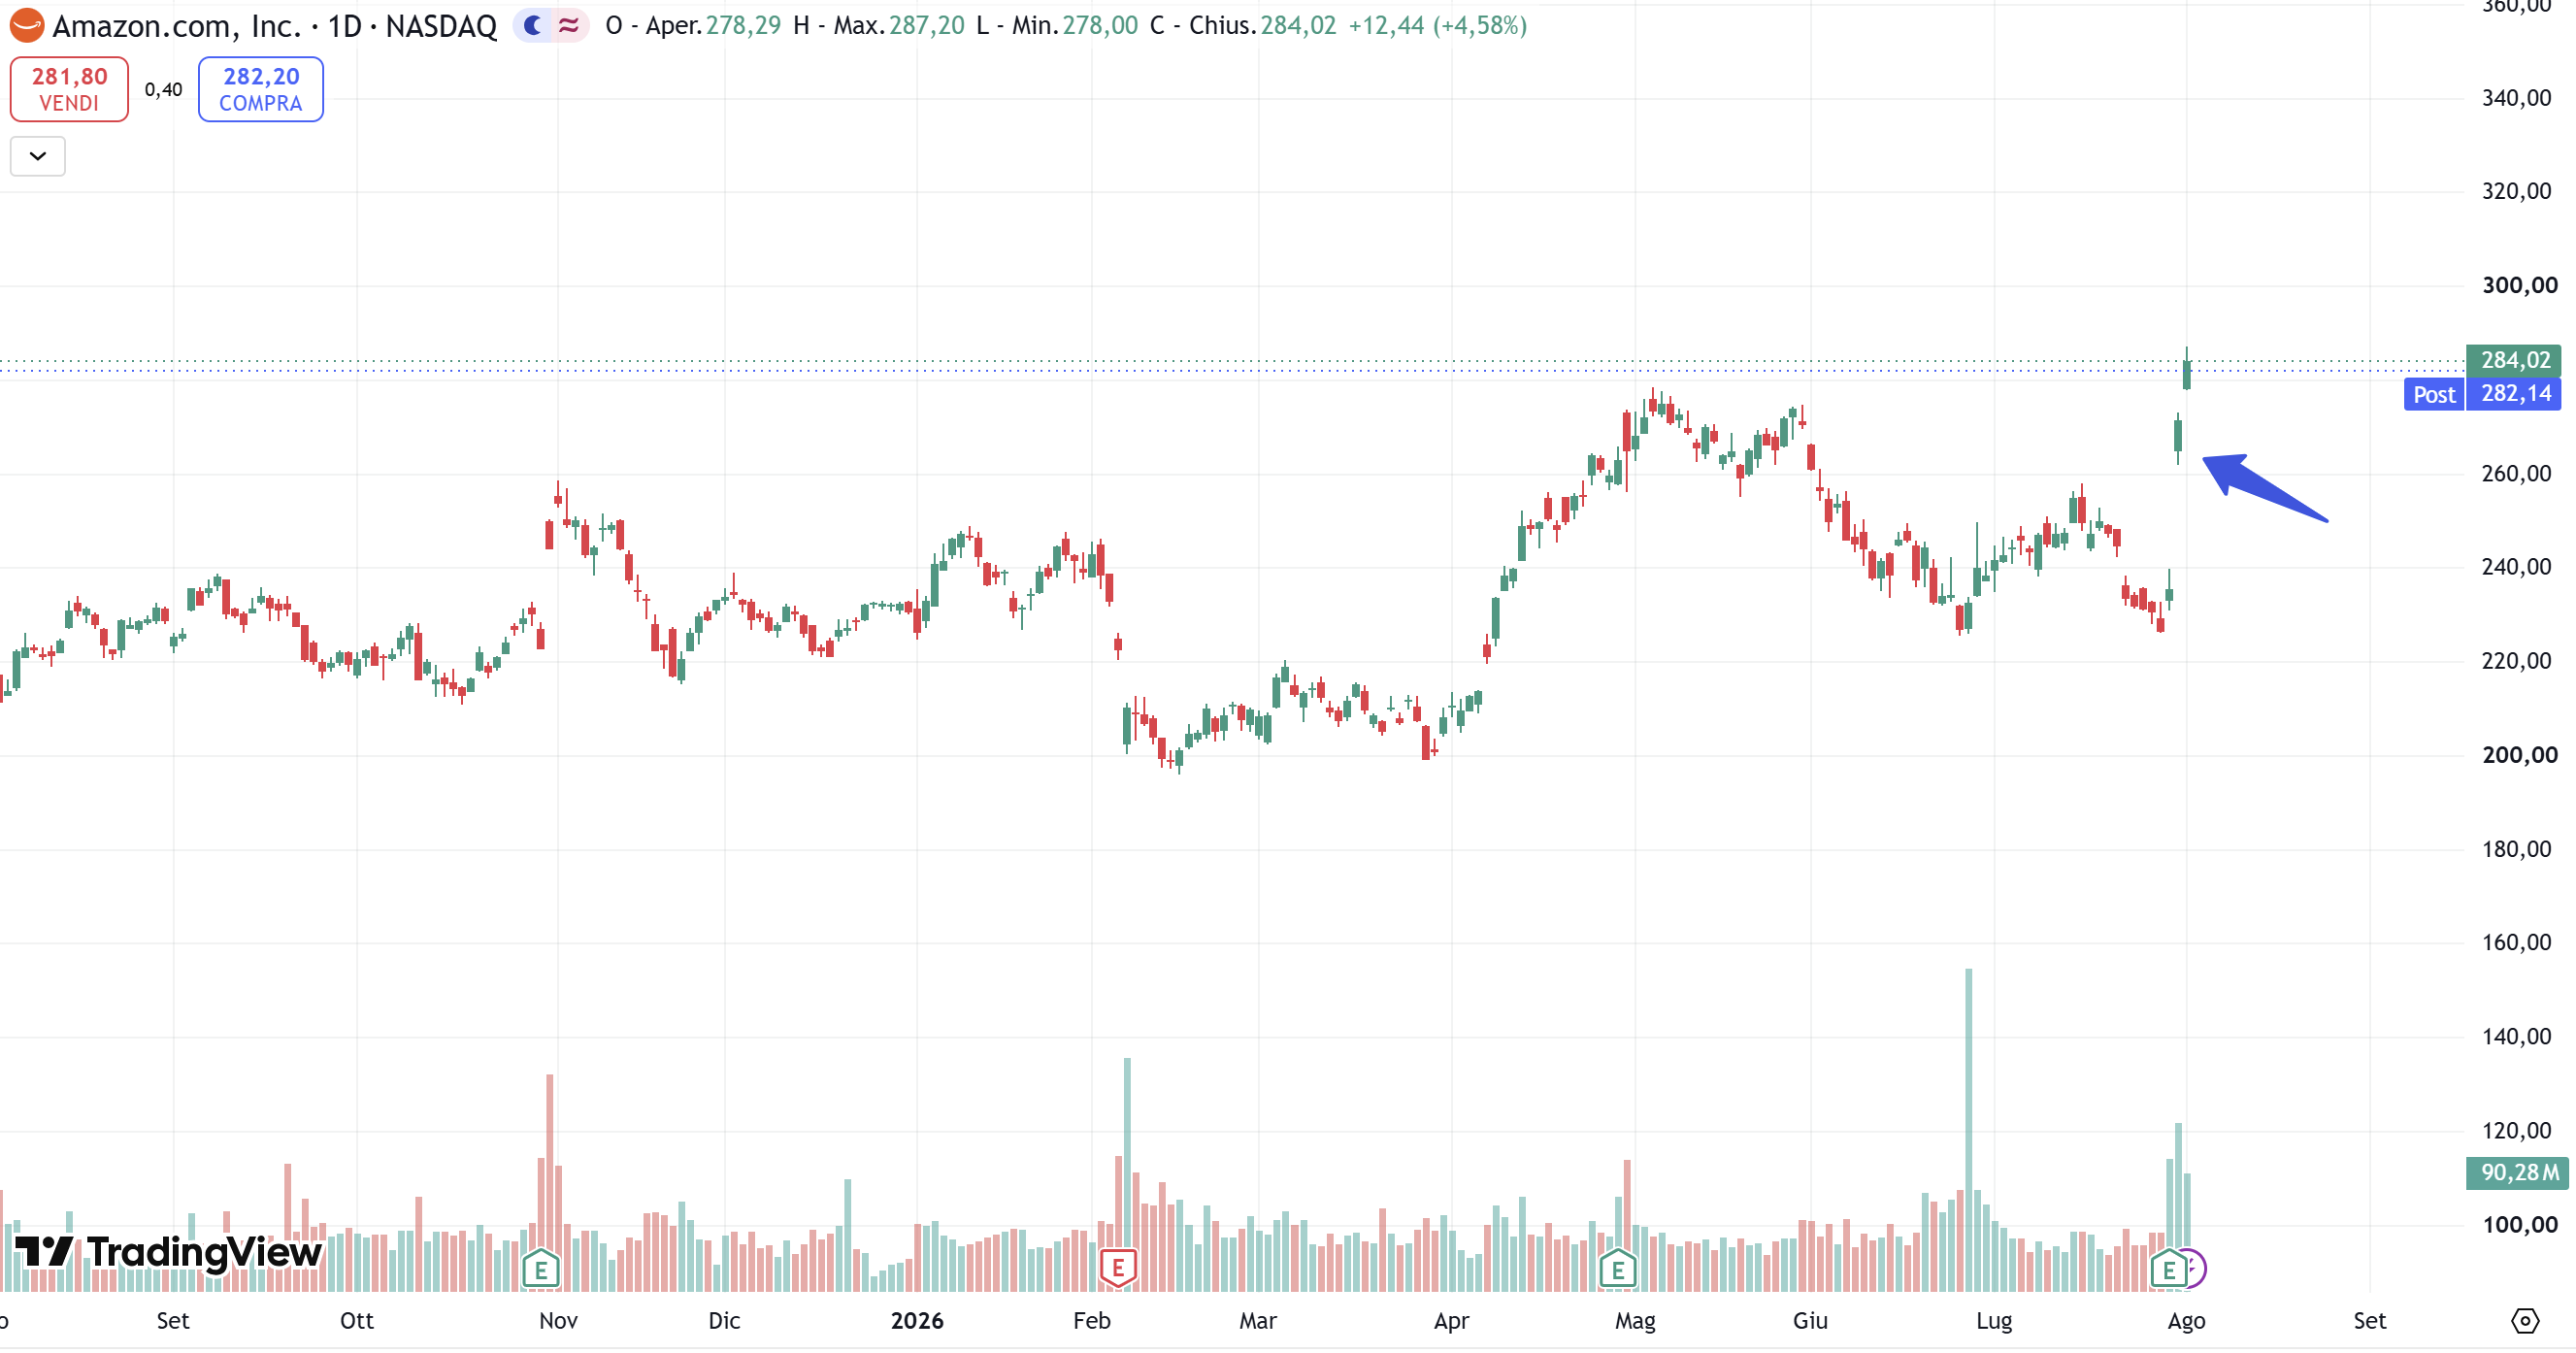
The move becomes even more significant when viewed in the context of the preceding weeks. After reaching the $275–280 range between May and June, Amazon had gradually corrected to around $235 on the eve of the earnings release. In a single session, the stock therefore recovered much of the previous decline, on volumes well above average.
The market appears to have rewarded, above all, the growing evidence that Amazon’s massive infrastructure investments are already translating into tangible results. AWS accelerated to its fastest growth rate in the past 18 quarters, margins expanded significantly, and backlog reached unprecedented levels, while the company simultaneously raised its CapEx outlook further.
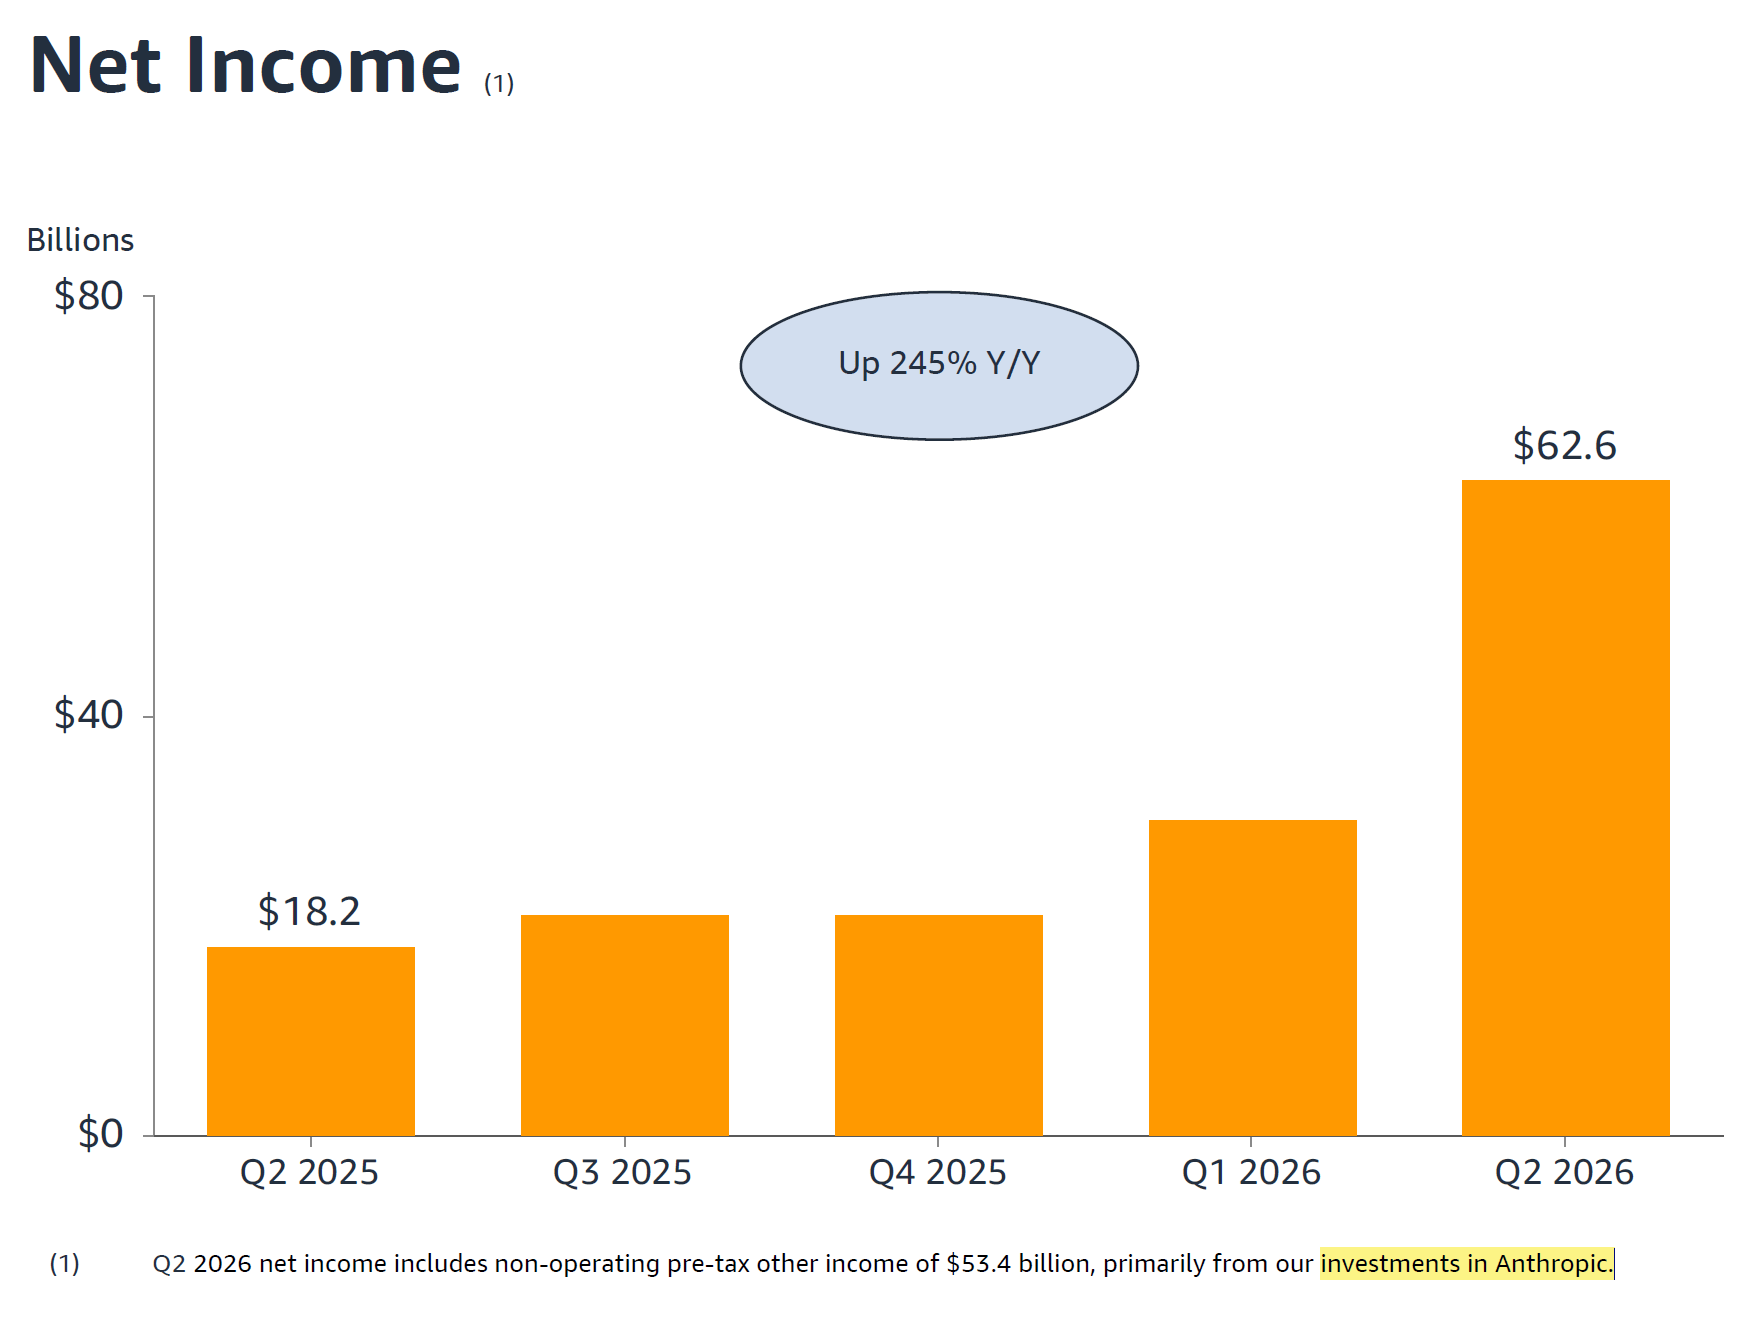
Consolidated revenue increased 20% to $200.6 billion, while operating income rose 43%, from $19.2 billion to $27.5 billion. Net income reached $62.6 billion, up from $18.2 billion a year earlier, but this figure should be interpreted with caution: the quarter included $53.4 billion in pre-tax non-operating income, primarily related to the revaluation of Amazon’s investment in Anthropic. To assess the quarter’s underlying operating quality, it is therefore much more useful to focus on revenue growth, operating income, and, above all, AWS.
AWS generated $42.2 billion in revenue, up 36.7%, accelerating for the fifth consecutive quarter and posting its fastest growth rate in the past 18 quarters. Sequentially, the segment added more than $4.6 billion in revenue, around 80% more than the previous record quarterly increase, bringing its annualized run rate to approximately $169 billion.
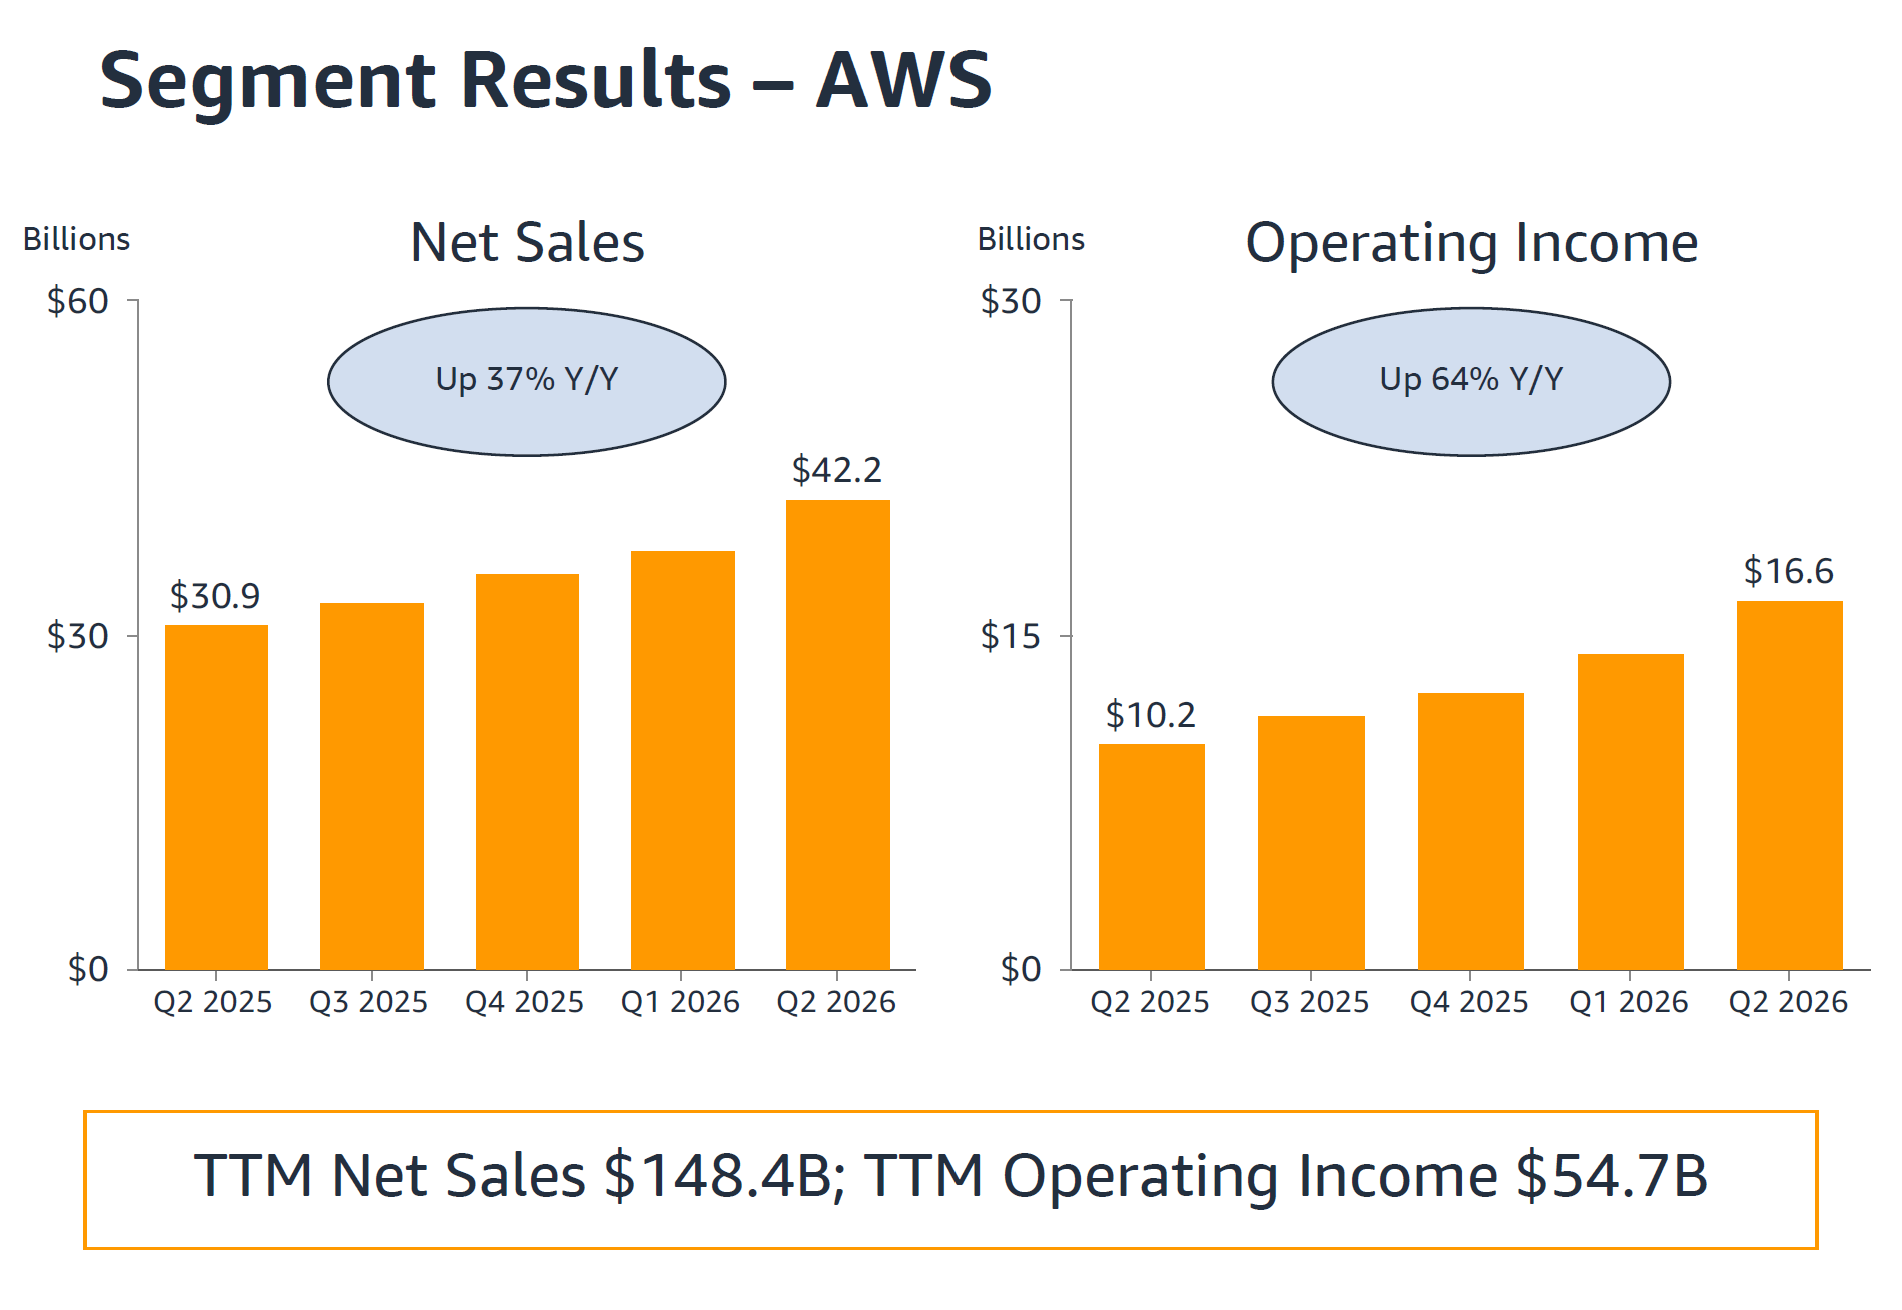
More importantly, the growth did not come at the expense of profitability. AWS operating income rose from $10.2 billion to $16.6 billion, up 64%, lifting the operating margin from around 33% to more than 39%. The quarter benefited from approximately $600 million in accounting gains related to the revaluation of certain energy contracts, but even excluding this effect, the improvement in profitability remains highly significant.
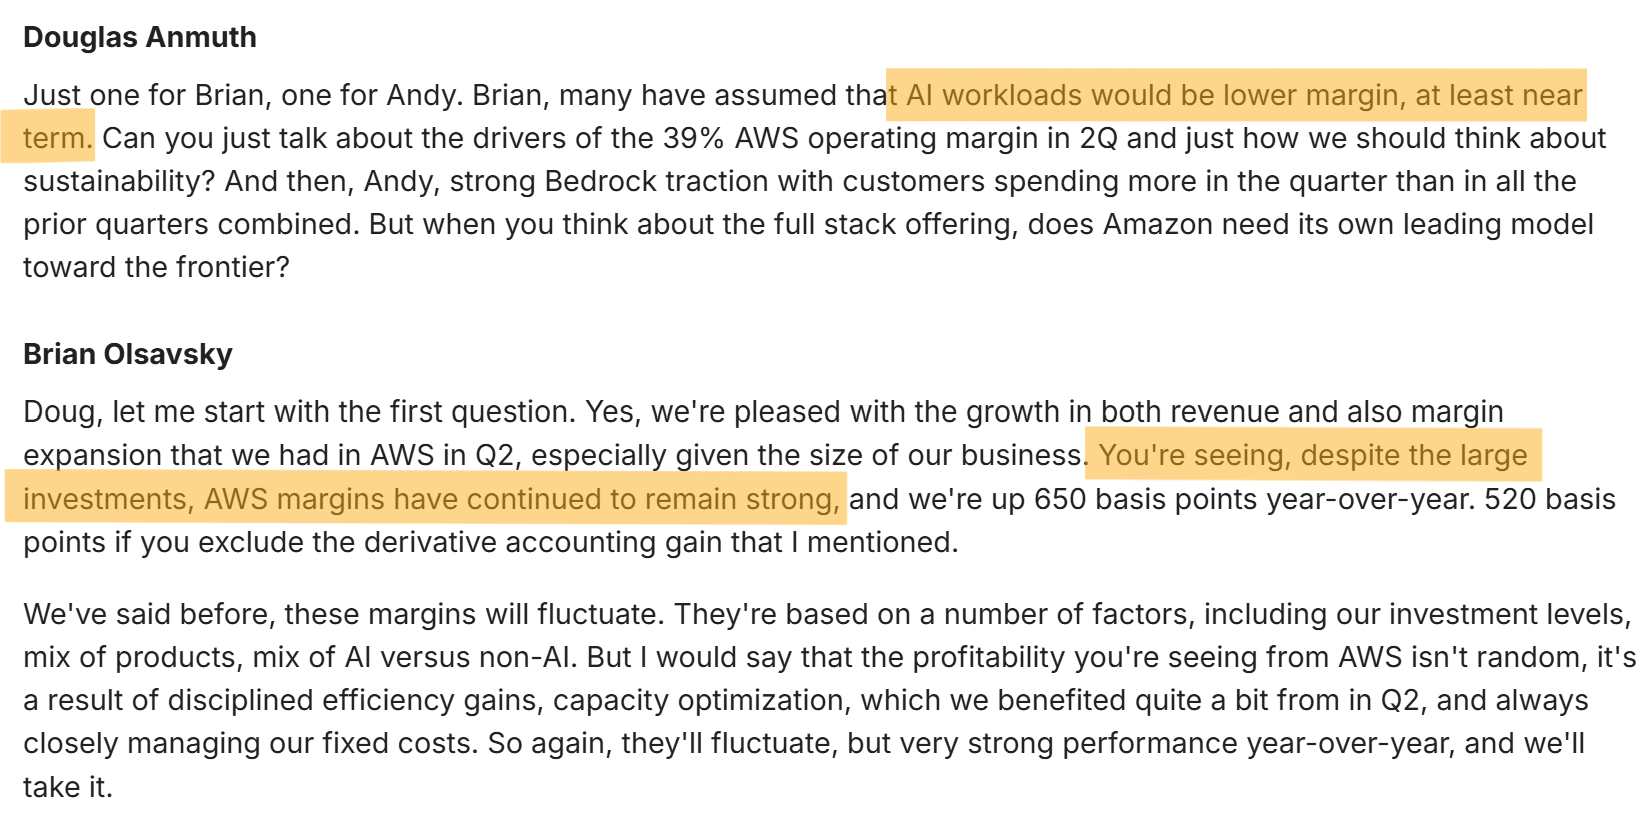
This is particularly important in the context of the current investment cycle. During the Q&A portion of the second-quarter earnings call, the issue of AI workload profitability was raised explicitly, with some investors and analysts suggesting that returns could initially be lower than those of traditional cloud workloads. For now, Amazon is showing encouraging signs: AWS is accelerating while profitability is improving, despite rising depreciation and the massive expansion of infrastructure capacity.
Visibility into future demand is equally significant. During the call, Andy Jassy indicated a $496 billion backlog, growing at a triple-digit rate year over year. Data reported in the 10-Q also show that contractual commitments for future services not yet recognized as revenue, predominantly related to AWS, amounted to approximately $496 billion, with a weighted-average remaining term of 6.4 years.
A significant portion of this growth comes from large model developers. In the first quarter, OpenAI expanded its multi-year agreement with AWS by $100 billion over an eight-year period, while in the second quarter Anthropic increased its commitment by more than $100 billion over ten years. Both agreements include contractual obligations tied to the performance of AWS chips.
A meaningful share of the backlog therefore comes from a small number of exceptionally large contracts. This increases concentration among a limited number of major customers and should be taken into account when interpreting the overall $496 billion figure. At the same time, these agreements strengthen visibility into future demand and make it difficult to argue that Amazon is building capacity without already having customers ready to use it. In fact, the company’s problem remains the opposite: available capacity is not sufficient to meet all customer demand.
AI monetization is already visible across several areas of the AWS offering. The business directly related to artificial intelligence has surpassed an annualized run rate of $25 billion, growing at more than 100% year over year. The proprietary chip business has also exceeded a $25 billion run rate and is growing at a triple-digit pace.
Trainium (Amazon’s proprietary AI chip) is securing multi-year, multi-gigawatt commitments from Anthropic and OpenAI, while Graviton (Amazon’s proprietary CPU chip for cloud workloads) is now used by 98% of the top 1,000 EC2 customers (Amazon Elastic Compute Cloud, one of AWS’s core services). Revenue commitments tied to Graviton have nearly tripled from the previous quarter, and Graviton5 is growing almost twice as fast as the prior generation. At the same time, Amazon continues to use NVIDIA at scale, giving customers the option to choose between third-party accelerators and proprietary hardware.
The role of proprietary chips should therefore not be viewed simply as a diversification strategy away from NVIDIA. Trainium and Graviton allow Amazon to directly influence the unit cost of compute, improving price-performance and therefore the overall economics of the infrastructure. It is the same mechanism seen at Microsoft with Maia and at Alphabet with TPUs: in a business where demand exceeds supply, increasing the performance generated by each dollar invested allows capacity, competitiveness, and returns on capital to expand simultaneously.
Monetization also extends further up the AWS stack. Bedrock (the AWS service that enables companies to access, customize, and use generative AI models) continues to accelerate sharply: hundreds of thousands of customers now use the service, more customers have been added in the past six months than in the first two years since launch, and customer spending in Q2 alone exceeded cumulative spending across all previous quarters.

Amazon is also expanding its offering through AgentCore, Kiro, and other services designed to build, deploy, and use AI agents directly on AWS infrastructure.
In other words, Amazon is not trying to monetize artificial intelligence through a single product. The company controls multiple layers of the value chain: data centers, CPUs, AI accelerators, infrastructure services, third-party models, developer tools, and agentic applications. The more AI usage grows, the greater the number of points at which AWS can capture a share of that spending.
During the call, however, management provided an even more interesting detail, explaining with particular clarity how it assesses the economic return on CapEx. Amazon now expects approximately $220 billion in cash CapEx in 2026, up from roughly $200 billion previously indicated, mainly because of higher memory prices. Most of that spending will continue to be directed toward AWS and artificial intelligence. Despite the increase in investment, the company still believes it will not have enough capacity to fully meet demand in 2026 and expects this situation could extend into 2027. Andy Jassy also emphasized that the demand already visible for 2028 is particularly strong.
The structure of the investment is therefore critical to understanding the current pressure on cash flow. Amazon distinguishes between two very different economic cycles.
Data centers require capital starting roughly two years before servers can be installed and begin generating revenue. The physical structure (building, electrical systems, and cooling infrastructure), once completed, has a long useful life,often spanning several decades, sometimes up to 30 years or more, and can house multiple successive generations of hardware, which instead have a much shorter useful life, typically ranging from 3 to 8 years for traditional servers and even less for the latest-generation GPUs dedicated to AI. The capital spent today to build the physical shell is therefore monetized only in the future, but it can support a long succession of technology cycles, since the hardware is renewed multiple times over the lifespan of the structure.
Servers and networking equipment, by contrast, operate on a much shorter cycle. Amazon generally purchases them only a few months before they are put into service, when it therefore has much greater visibility into actual demand. According to management, these investments reach break-even on average in just under three years, while servers currently have a useful life of at least five or six years. Much of the new AI capacity is also contracted for periods of at least five years.
The economic logic is important: Amazon is currently committing an enormous amount of capital to infrastructure that cannot yet generate revenue, while the hardware component is purchased much closer to actual utilization and is often backed by contract durations longer than the period required to recover the investment.
Once a data center has been built, moreover, subsequent generations of servers should generate better economic returns because they do not require the initial investment in the building and physical infrastructure to be repeated. According to Amazon, a data center with a useful life of more than 30 years should support at least five or six generations of servers.
It is precisely this timing mismatch that explains the deterioration in free cash flow.
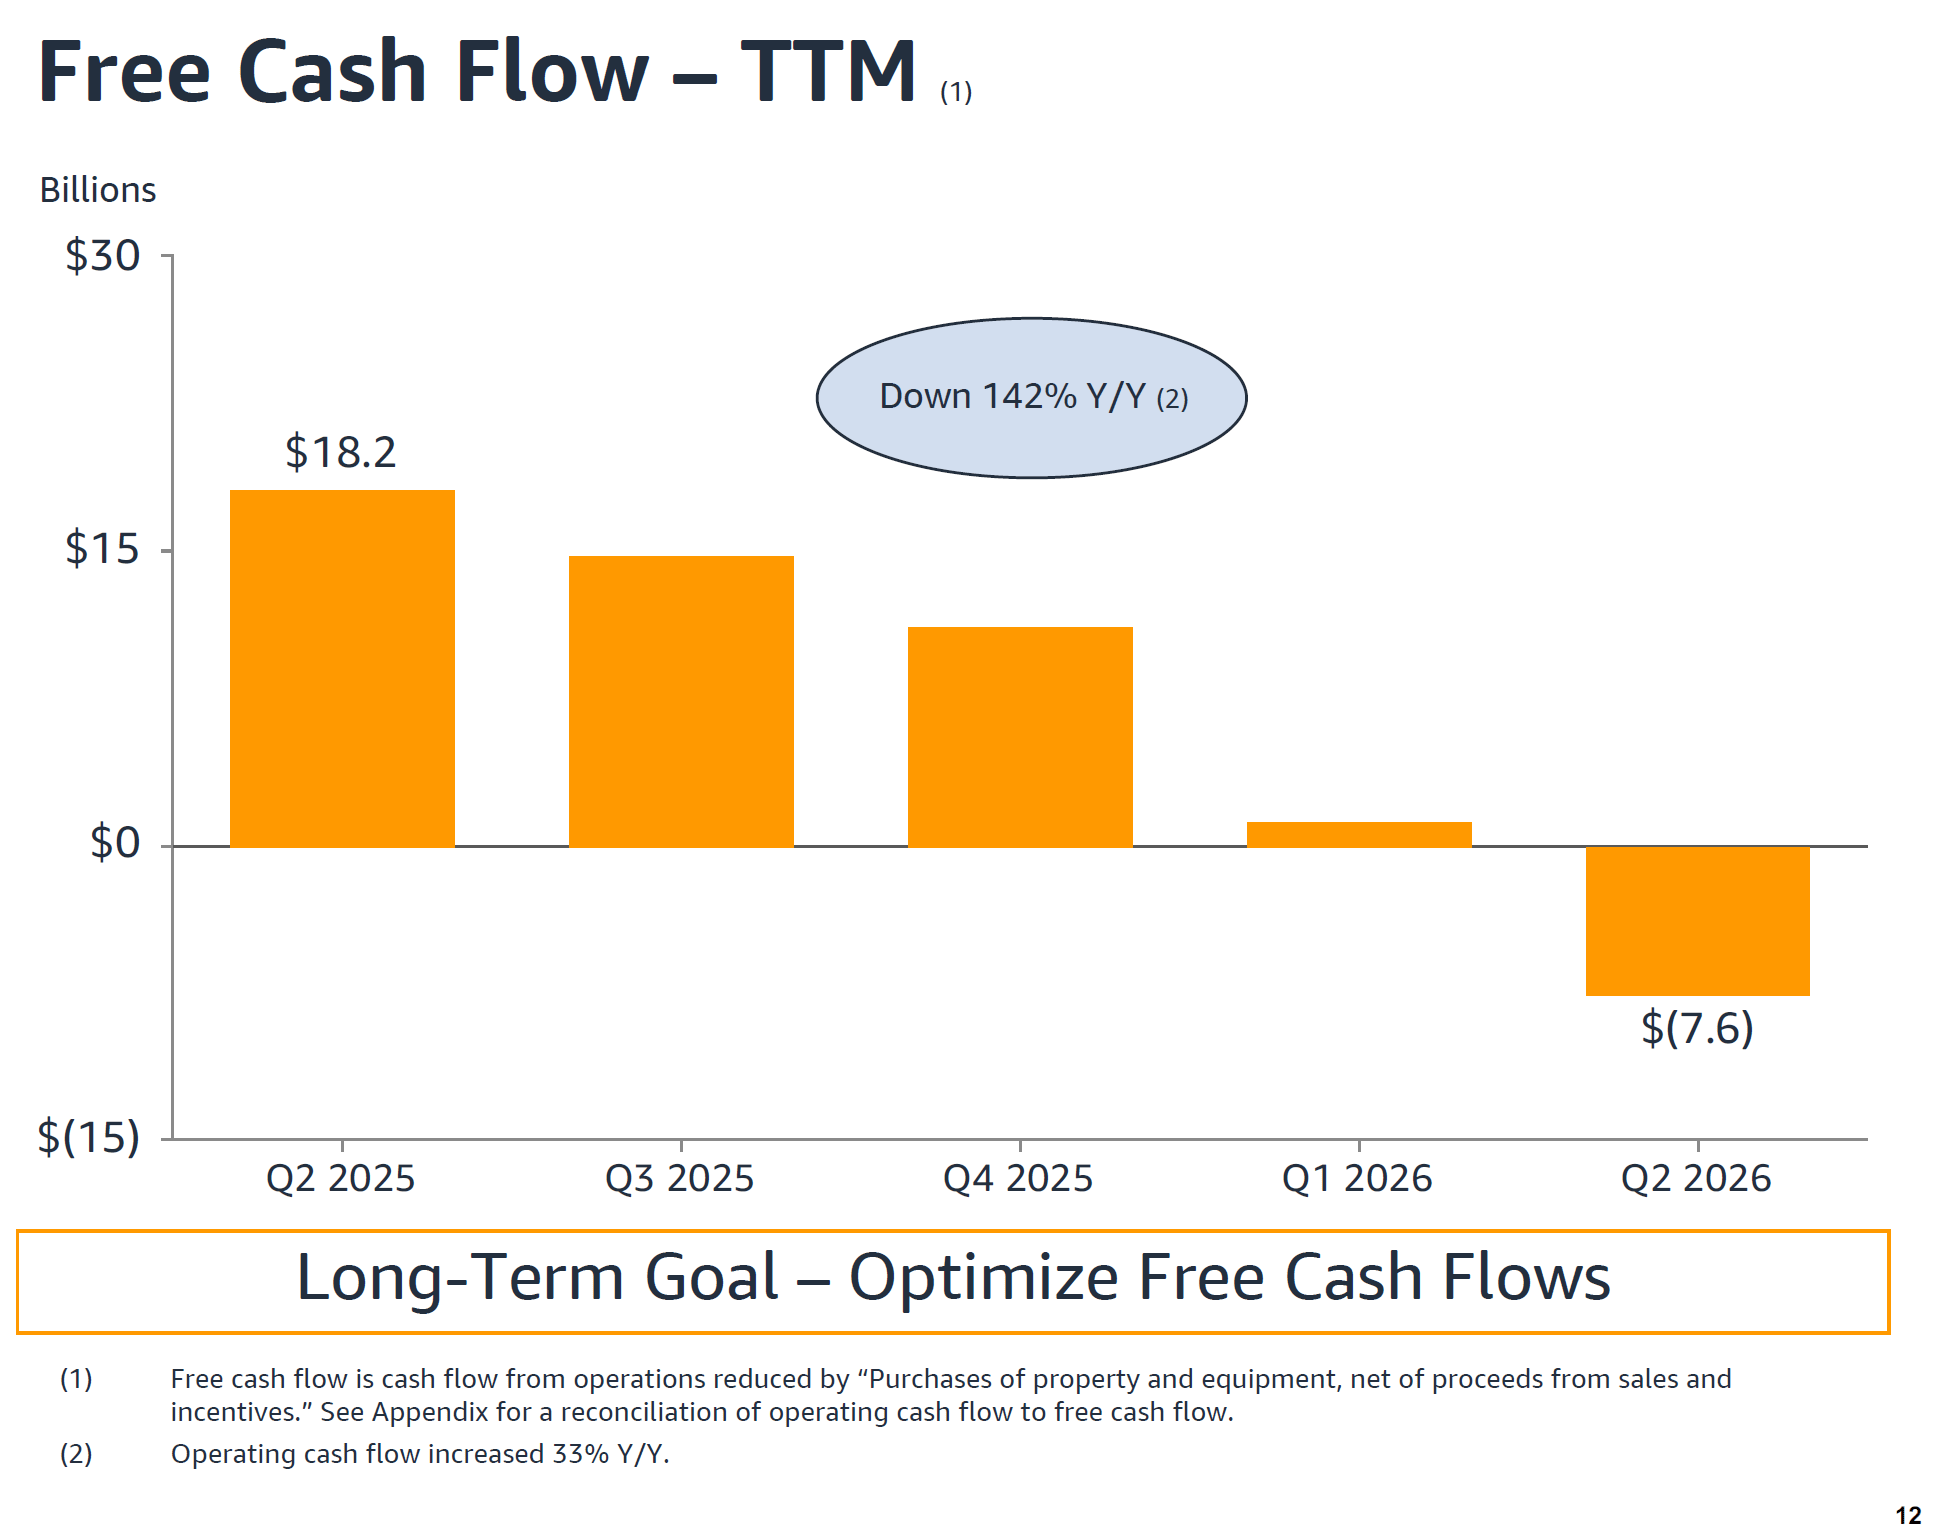
Over the last 12 months, Amazon generated $161.4 billion in operating cash flow, up 33%, but purchases of property and equipment, net of proceeds from sales and incentives, reached approximately $169 billion. The intensity of the investment cycle has therefore progressively absorbed cash generation: TTM free cash flow fell from $18.2 billion in Q2 2025 to $14.8 billion in Q3, $11.2 billion in Q4, $1.2 billion in Q1 2026, and finally -$7.6 billion in the most recent quarter. The deterioration therefore does not reflect a reduced ability of the business to generate operating cash flow, which continues to grow rapidly, but rather the fact that CapEx is rising even faster.
At the same time, the 10-Q shows how aggressively AWS is expanding its infrastructure base. In the second quarter alone, net additions to property and equipment attributed to the segment rose from $16.0 billion to $48.6 billion, while depreciation increased from $4.8 billion to $8.1 billion. Despite this sharp rise in infrastructure-related costs, AWS was able to accelerate revenue growth while also expanding its operating margin significantly.
This is probably the most important signal from the entire quarter. Free cash flow is deteriorating because Amazon is building capacity far faster than assets still under construction can currently contribute to revenue, not because the capacity already available is struggling to be utilized or monetized.
The investment cycle is nevertheless also changing the group’s financial profile. Long-term debt increased from $65.6 billion at the end of 2025 to $128.9 billion in June 2026, while in the first six months of the year Amazon raised approximately $67 billion through new long-term debt issuance. The period, however, also included major strategic investments outside ordinary CapEx, including new stakes in OpenAI and Anthropic, meaning that the increase in debt cannot be attributed solely to the buildout of AWS capacity.
Amazon’s financial position nevertheless remains very strong. At the end of June, the company held approximately $123 billion in cash, cash equivalents, and marketable securities, while operating cash flow continues to grow. This is therefore not a question of financial sustainability, but rather a change in how the company is funding an unprecedented phase of infrastructure expansion.
Unlike Microsoft, the current investment program can no longer be fully absorbed by the free cash flow generated by the business. This makes execution increasingly important: the longer CapEx continues to grow faster than operating cash flow, the greater the need for new capacity to come online and begin generating revenue according to the expected timeline.
Meanwhile, AI is beginning to have an impact outside AWS as well. Advertising reached $19.8 billion in revenue, up 26%, while tools such as Ads Agent are reducing costs and improving campaign efficiency. Alexa for Shopping is also linking artificial intelligence directly to purchasing behavior: active users have nearly doubled, while interactions have increased more than fivefold year over year.
In the United States, customers who use Alexa for Shopping spend on average more than 40% more per order than other users, while those who have tried Alexa+ subscribe to Prime at a rate almost 25% higher. These figures do not yet show what the overall economic contribution of AI to retail will ultimately be, but they indicate that Amazon is beginning to use these tools not only as standalone products, but also to increase engagement, conversion, and the value of its existing ecosystem.
Amazon’s position is therefore very different from that of a company asking investors to fund today a possible source of demand in the future. Demand is already visible in the backlog, available capacity remains insufficient, AWS is accelerating, the AI business has already reached meaningful scale, and margins are increasing despite the sharp rise in depreciation.
The real question is instead the timing of the cash return.
Amazon is front-loading enormous investments today in data centers that will progressively come online over the next several years. If, as management argues, revenue growth is eventually able to outpace incremental CapEx growth once this phase is completed, the current compression in free cash flow could primarily represent the upfront cost of an expansion designed to generate returns for many years. Amazon also argues that AI margins and returns are following a trajectory at least comparable to, and for now slightly better than, that seen in traditional cloud computing at the same stage of development.
The economic chain of AI investment therefore already appears fairly clear:
CapEx → new AWS capacity → contracted utilization → revenue growth → high margins → free cash flow deferred over time.
The main difference versus Microsoft lies in the final step. Microsoft is demonstrating that it can sustain exceptionally high levels of investment while already maintaining strong free cash flow generation today. Amazon, by contrast, is temporarily sacrificing cash generation in order to build capacity well ahead of its monetization.
For now, the market appears willing to accept this trade-off, because AWS continues to show that available capacity is being absorbed rapidly and because there is already strong contractual visibility into future demand. The 15% gain in the stock following the earnings release is probably the clearest indication of how investors are evaluating the current CapEx cycle: what matters is not only how much a Big Tech company is spending, but how clearly it can demonstrate that this spending will translate into revenue, margins, and, with a lag of several years, free cash flow.
Meta: the core business is strong, but the link between CapEx and new revenue remains less visible
Meta presents the clearest contrast between the performance of its existing business and the still-uncertain returns on AI infrastructure.
Second-quarter revenue increased 28% to $60.8 billion, supported by a 14% increase in ad impressions and a 12% rise in the average price per ad. The core advertising business therefore remains extremely strong.
The call, however, clarified an important point: AI investments are already producing tangible benefits within the existing business. Zuckerberg explained that artificial intelligence is improving the relevance of content shown on Instagram and Facebook, increasing user engagement and strengthening Meta’s ability to predict, rank, and optimize advertisements. According to management, Meta’s advertising business is currently growing faster year over year, in revenue terms, than that of any other major player in the industry.
Advertiser adoption of AI tools is also accelerating. Around 9 million small businesses already use at least one of Meta’s AI-powered advertising creative tools, while the new Muse Image and Muse Video models are expected to further expand advertisers’ ability to generate and test creative content more quickly and effectively. This is relevant because it confirms that part of the CapEx is already supporting tangible monetization within the core business, even as the market continues to demand greater visibility into the direct returns on the new infrastructure.
The strength of the core business is also supported by an exceptionally large user base. During the quarter, 3.6 billion people used at least one Meta app every day; Instagram reached 2 billion daily active users, while Threads surpassed 500 million monthly active users. This scale reinforces the company’s competitive advantage both in distributing new products and in advertising monetization, because it allows Meta to apply AI-driven improvements to a massive user base almost immediately.
At the same time, total costs increased 55% to $42 billion, compressing the operating margin from 43% to 31% and reducing operating income by 8%.
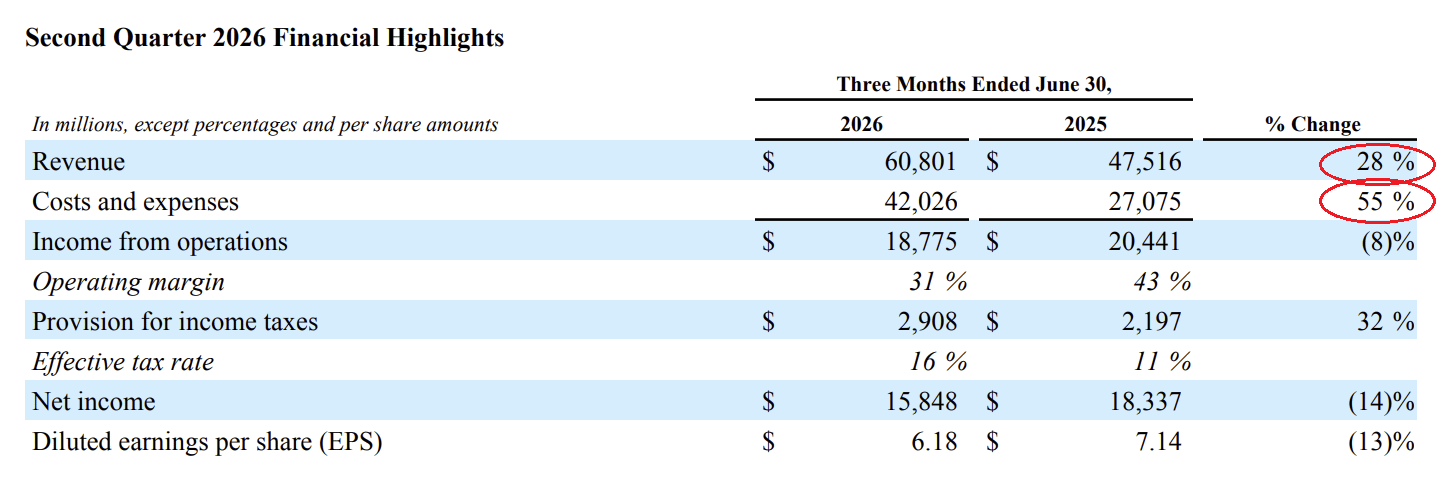
The quarter included $2.4 billion in legal charges and $1.18 billion in restructuring costs, but the divergence between revenue growth and cost growth remains significant.
The most concerning signal came from cash generation. Meta generated $31.9 billion in operating cash flow, but CapEx, including finance lease payments, reached $31.1 billion. As a result, free cash flow fell from $8.55 billion a year earlier to just $784 million.
The company also narrowed its 2026 CapEx guidance to $130–145 billion, raising the lower end from the previous range of $125–145 billion.
Meta is already using AI to improve content ranking, engagement, and advertising campaign efficiency. However, unlike Microsoft, Alphabet, and Amazon, it still does not have a major cloud business capable of selling the new compute capacity directly to external customers.
Potential future sources of monetization—personal agents, business agents, APIs, smart glasses, and the sale of excess capacity—remain at an early stage.
The call provided some additional detail on these areas of development. Meta explained that it sees three major areas of opportunity: personal agents, which are expected to become a new category of consumer product; business agents, already used every week by more than 1 million businesses on WhatsApp and Messenger; and a broader enterprise opportunity that includes APIs, services for large customers, and the potential direct sale of compute capacity.
The expected monetization model combines subscriptions, volume-based pricing, and, over time, more outcome-based models similar to the logic of advertising.
The key point, however, is that these business lines remain at an early stage relative to the scale of the infrastructure Meta is building. Unlike Microsoft or Amazon, which can already show a very visible link between additional capacity and cloud growth, Meta is asking investors to focus primarily on the future potential of these products rather than on monetization that is already fully visible in current financial results.
As a result, the market has greater difficulty seeing a direct link between CapEx and incremental revenue.
To reduce the immediate cash outlay, Meta has also begun adopting external financing structures. In the $14 billion joint venture with funds managed by BlackRock, those funds will own 80% of the project, while Meta will retain 20%. The company will be able to use the entire campus through lease agreements without directly financing the full project.
The call also clarified that Meta continues to operate in an environment where internal demand for compute capacity exceeds available supply and expects to have numerous positive-return uses for additional capacity at least through 2026 and 2027, not only in new AI initiatives but also in the core business.
Management explained that beyond 2027 it prefers to preserve flexibility, focusing today primarily on securing access to land and power while postponing decisions on more expensive purchases, such as chips and other critical components.
This leads us to believe that infrastructure pressure is unlikely to ease in the near term: even if the mix of spending evolves, capacity requirements will likely remain elevated for several more quarters.
The structure reduces the initial cash requirement, but it does not eliminate the economic risk: Meta will continue to incur lease payments and has provided guarantees on the residual value of the infrastructure. In substance, part of the CapEx is being transformed into future contractual obligations and potential liabilities rather than disappearing from the company’s financial profile.
The stock fell by approximately 8–10% following the results.
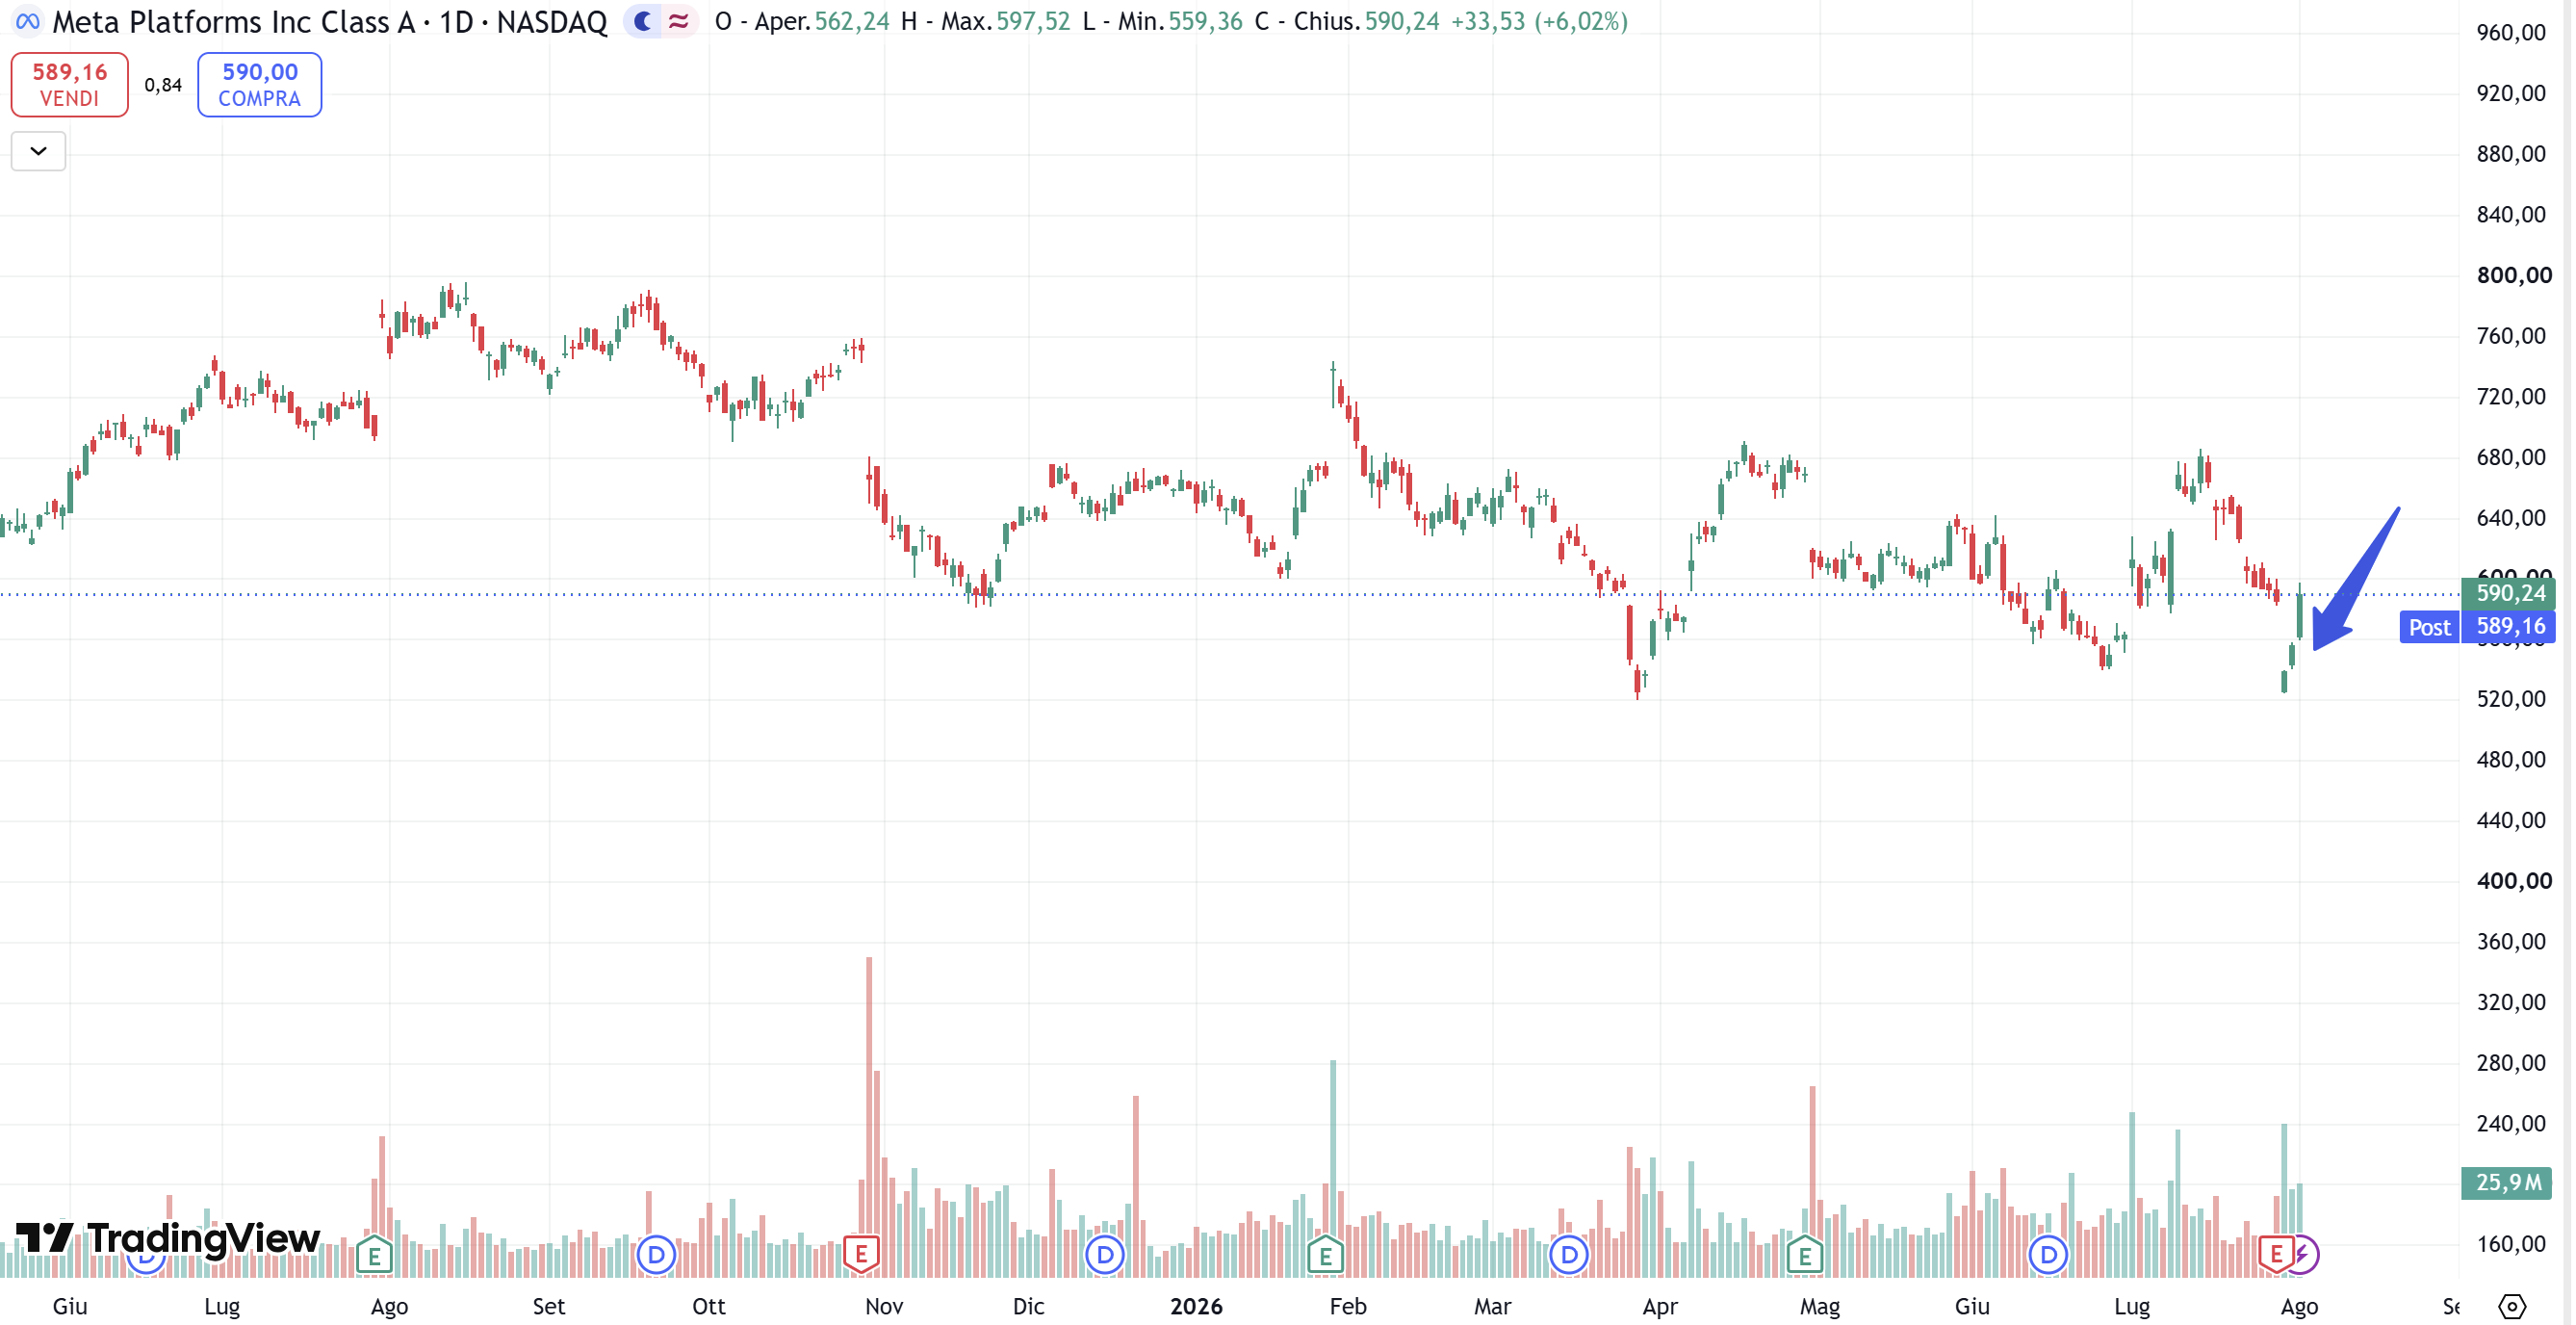
The market reaction therefore does not call into question the strength of the advertising business, nor the fact that AI is already improving engagement, ranking, and ad performance. The issue lies elsewhere: the scale of infrastructure investment is growing faster than visibility into incremental returns outside the core advertising business. Until Meta can demonstrate more convincingly that personal agents, business agents, APIs, and enterprise services can translate into recurring revenue large enough to justify the new level of spending, investors are likely to view CapEx more as a drag on free cash flow than as an immediate driver of multiple expansion.
Our view remains cautious. Meta continues to show an extremely resilient core advertising business, and AI is already helping improve its performance. However, as long as CapEx continues to rise and absorb an increasing share of operating cash flow, without sufficiently strong revenue acceleration to demonstrate unequivocally that infrastructure investment is generating tangible incremental returns, a sustained re-rating of the multiple will remain difficult.
In other words, the market is not questioning the quality of the existing business, but is asking for stronger evidence that the new compute capacity can translate into a second engine of growth and monetization large enough to offset the current cash drain.
Apple: iPhone accelerates, but the outlook weighs on the stock
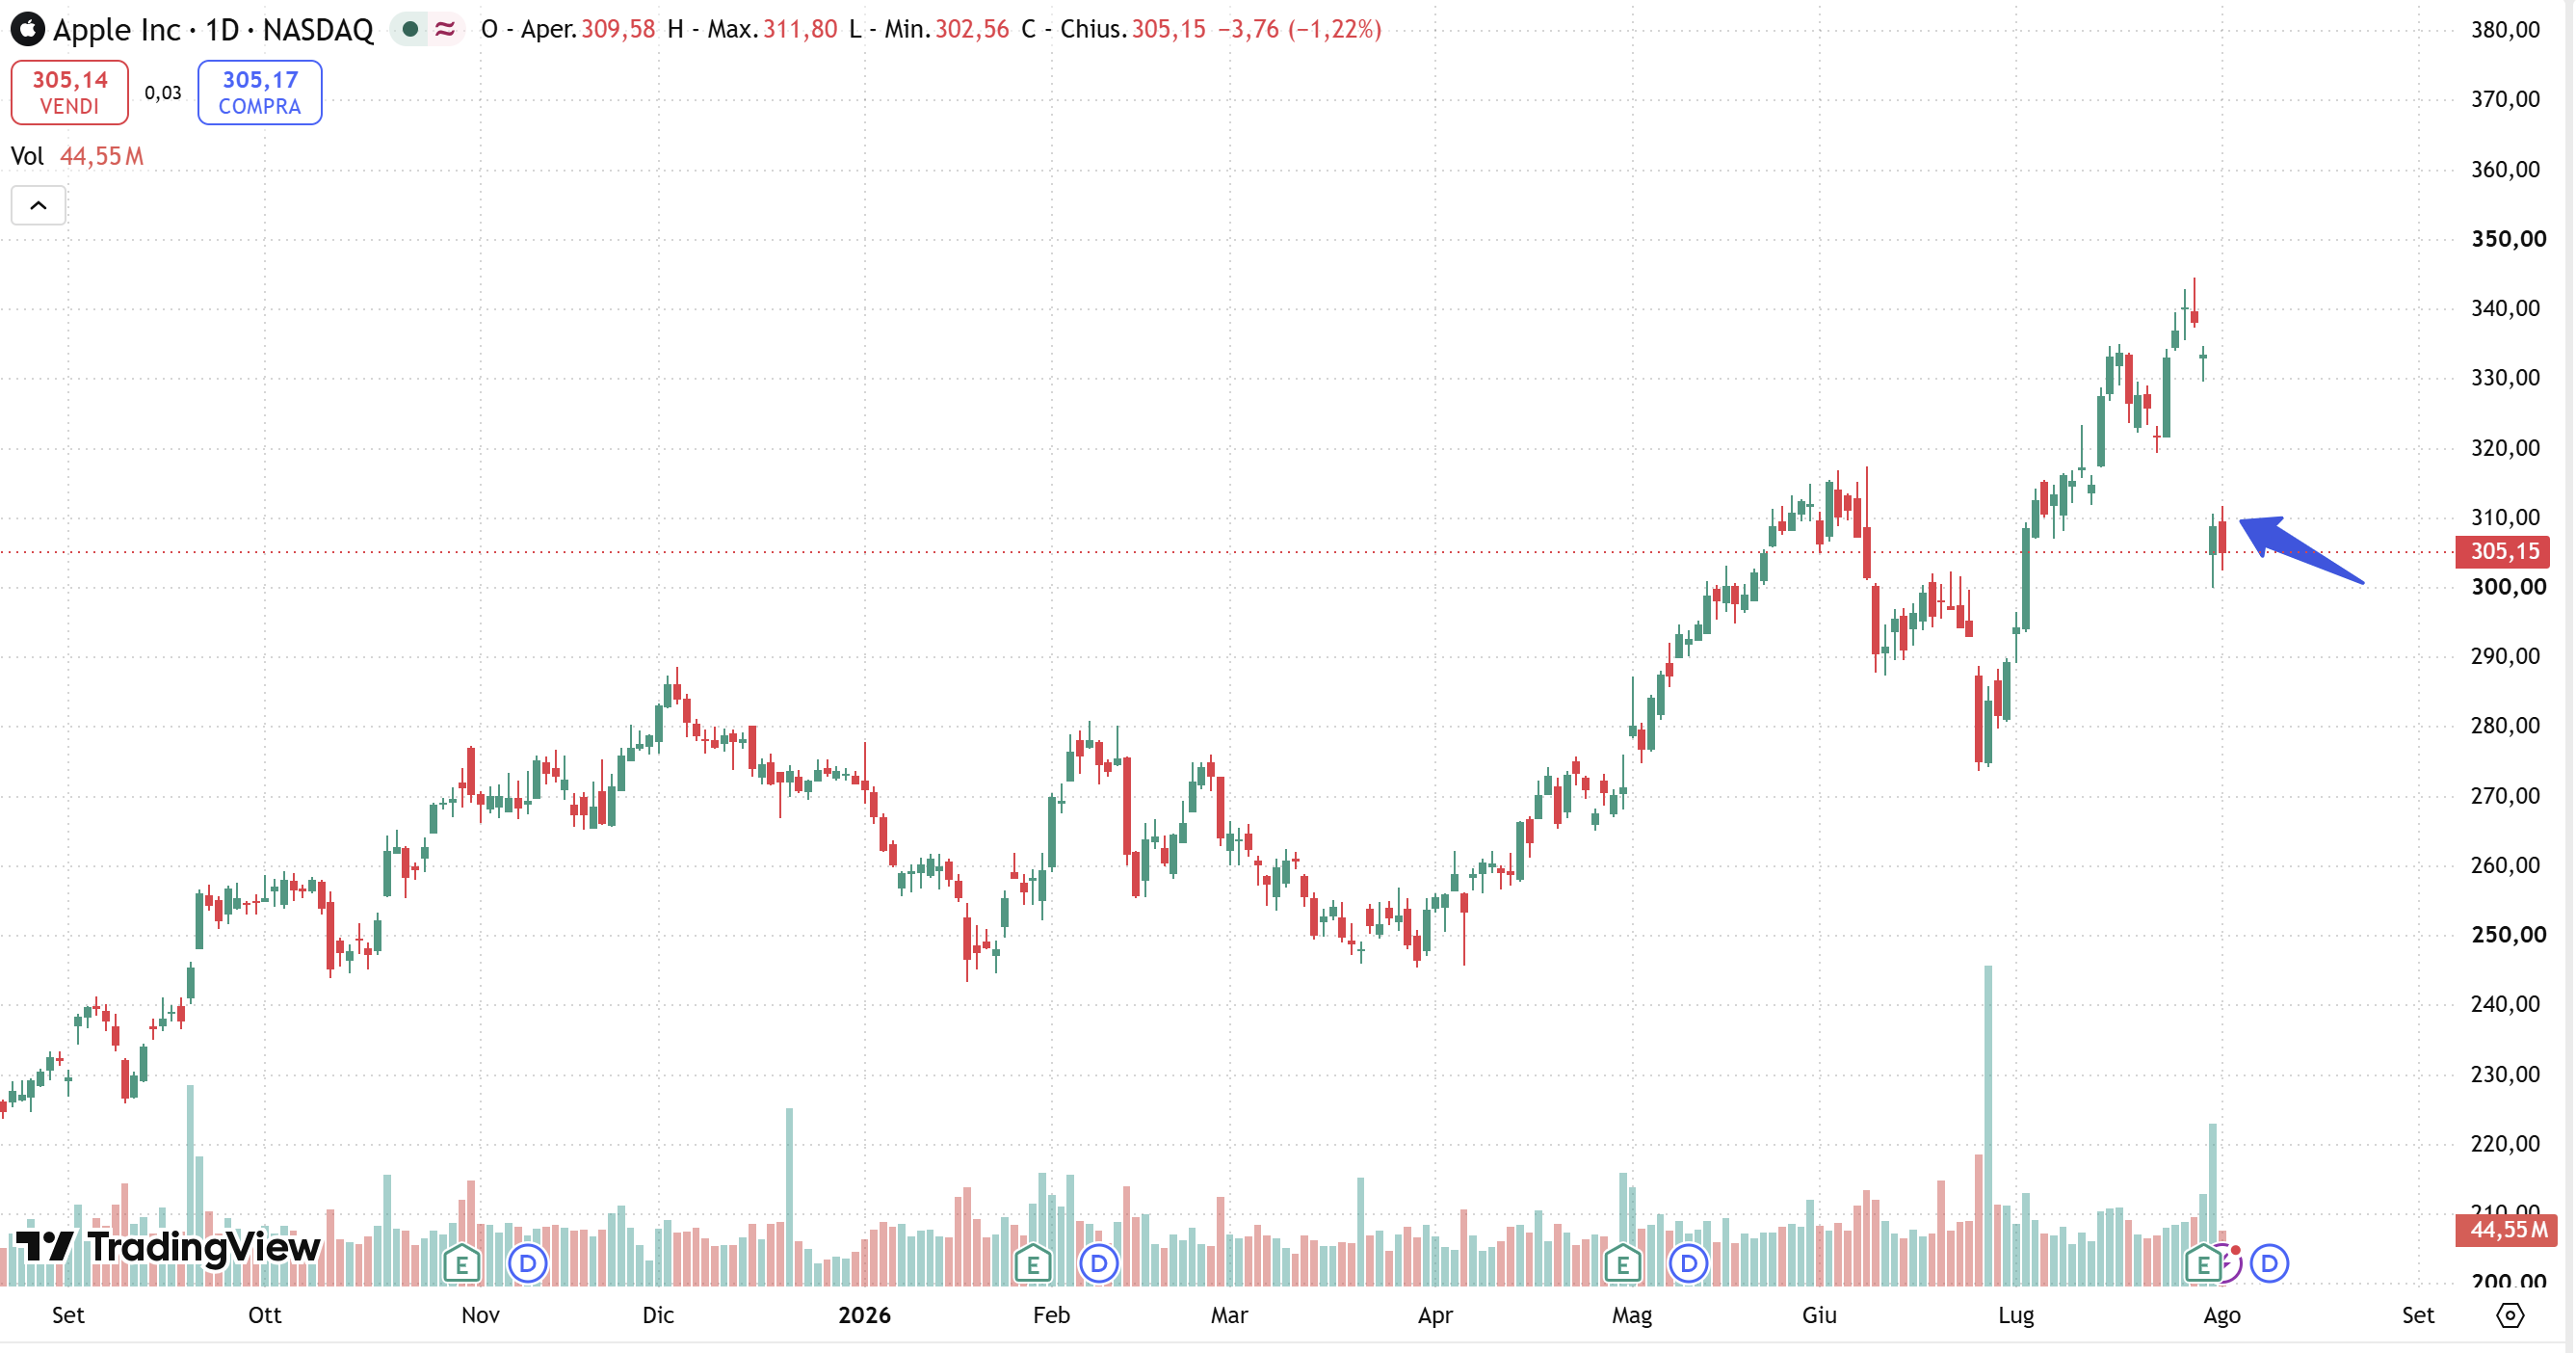
Apple reported an exceptionally strong June quarter, but the market looked beyond the results just released and focused primarily on the outlook for the coming months. In the session following the earnings report, the stock fell by around 7%, after dropping as much as 10% intraday, abruptly interrupting the rally that had pushed the shares to recent highs in the preceding weeks.
The quarter’s results are difficult to criticize. Revenue increased 16% to $109.4 billion, while operating income rose from $28.2 billion to $35.7 billion and net income from $23.4 billion to $29.8 billion, up 27%. Diluted EPS increased from $1.57 to $2.02.
Once again, the main driver of growth was the iPhone. Revenue increased 22% to $54.3 billion, representing almost half of total quarterly revenue. Mac also delivered particularly strong performance, with revenue up 29% to $10.4 billion, while Wearables, Home and Accessories grew 6%. The only hardware category to decline was iPad, with revenue down 6%.
Strength was also broad-based geographically. In particular, the Greater China segment (mainland China, Hong Kong, and Taiwan) returned to growth, with revenue increasing 22% to $18.8 billion, driven primarily by the iPhone. Europe and Rest of Asia Pacific grew 22% and 16%, respectively, while the Americas posted an 11% increase.
The iPhone therefore remains Apple’s primary growth engine. Its importance goes beyond its immediate contribution to revenue: every additional device sold expands the installed base and deepens customer integration within the Apple ecosystem, creating further monetization opportunities over time through Services, iCloud, apps, payments, wearables, and future replacement cycles.
The call, however, clarified an important aspect of the guidance. For the September quarter, Apple expects revenue growth of 9% to 11%, compared with the 16% just reported and a consensus of around 12% referenced by analysts during the call. The slowdown does not, however, appear to reflect a deterioration in demand. Management expects an approximately 2.5 percentage-point headwind from foreign exchange and, above all, a significant increase in supply constraints affecting iPhone, Mac, and iPad.
Tim Cook explained that the main bottleneck is the availability of advanced process nodes used for Apple SoCs, but he also made clear that the primary cause is not a supplier issue: iPhone and Mac are simply selling much better than Apple itself had expected. The company is pulling forward supply wherever possible, but the supply chain currently has less flexibility than in the past.
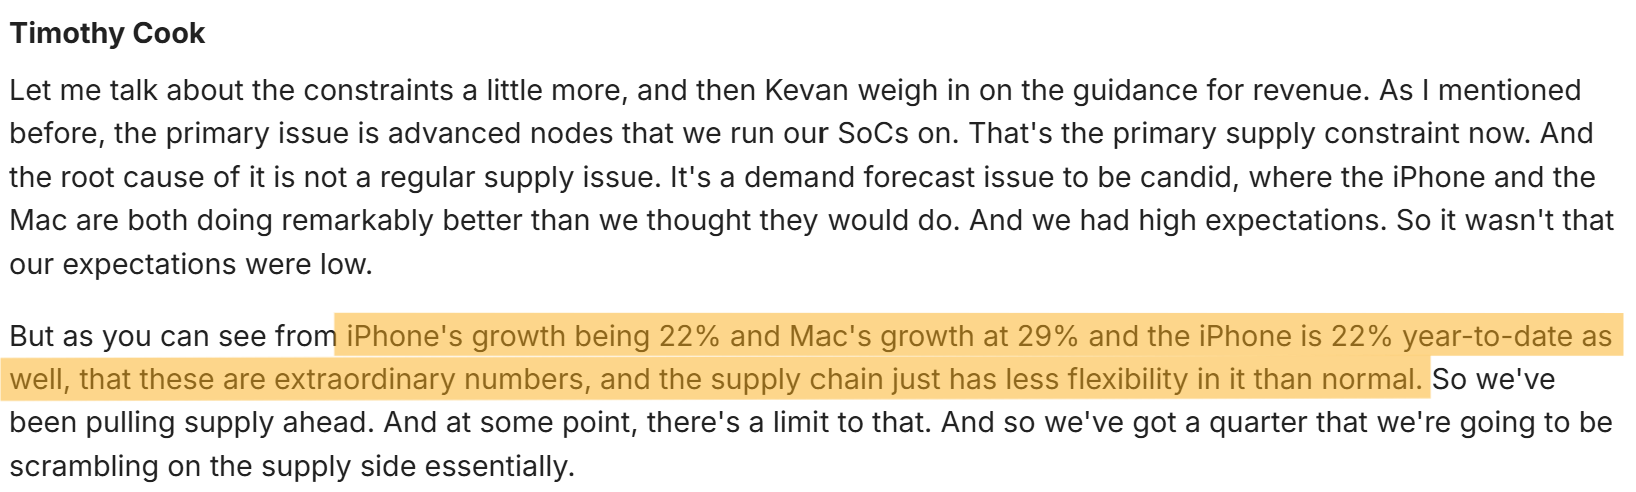
iPhone growth is expected to slow from 22% to around 15% in the September quarter. The key point, however, is that the slowdown does not appear to be driven by weaker demand, but primarily by supply constraints that will prevent Apple from fully meeting customer demand. In other words, the underlying operating signal is stronger than the guidance alone might suggest.
Services also reached a new record, with $30.7 billion in revenue, up 12%. The slowdown versus previous quarters, however, needs to be interpreted carefully. During the call, management explained that foreign exchange was the main factor behind the deceleration, while the App Store was also affected by greater weakness in mobile gaming and changes to its business model in certain markets. Despite these pressures, cloud services, advertising, video, and payment services continued to grow at double-digit rates, and Apple surpassed 1.5 billion paid subscriptions across an installed base of more than 2.5 billion active devices.
A second area of attention is margins. Gross margin rose to 50.1%, but benefited by around two percentage points from tariff refunds. Excluding this effect, the margin would have been around 48.1%. For the September quarter, Apple expects gross margin of 47% to 48%, including approximately one percentage point of benefit from tariff refunds.
The main pressure, however, is not coming from foreign exchange, but from memory costs. During the Q&A, management explained that more than 100% of the underlying margin decline expected between June and September is attributable to higher memory prices, partially offset by lower costs for other components, favorable mix, and the use of inventory purchased at earlier prices. Tim Cook described the current memory pricing environment as a “100-year flood,” adding that Apple has already raised prices on some products, albeit reluctantly.
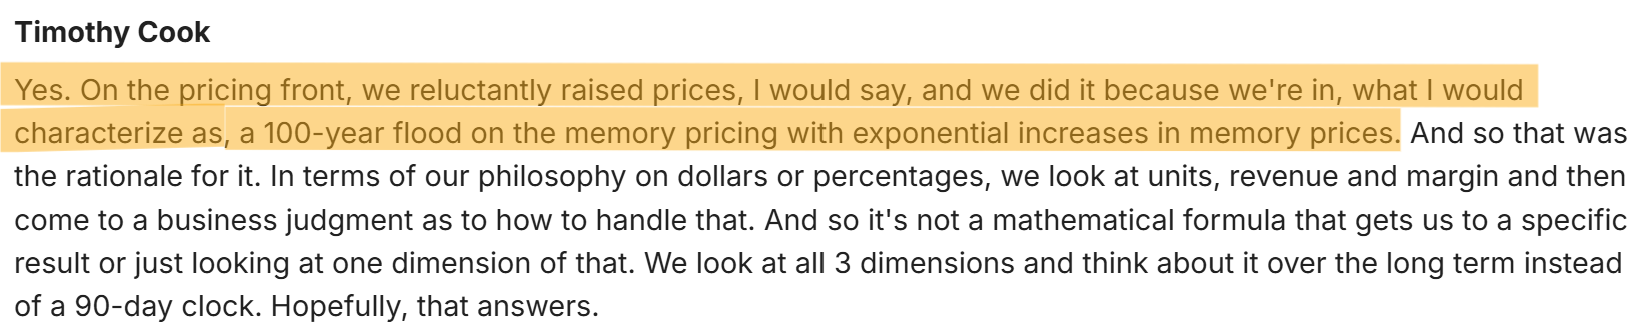
This is probably one of the most important variables for the coming quarters. Apple believes that market memory prices could continue to rise beyond September, while the benefit from inventory purchased earlier is expected to gradually diminish. The risk therefore concerns not only product availability, but also Apple’s ability to preserve margins without undermining demand through further price increases.
Apple, however, represents a very different case from the hyperscalers discussed earlier. Microsoft, Alphabet, Amazon, and Meta are sustaining exceptionally high levels of CapEx to build data centers and AI compute capacity. Apple’s numbers do not yet show a comparable increase in capital intensity: in the first nine months of the fiscal year, payments for property, plant, and equipment amounted to $6.8 billion, compared with $9.5 billion in the same period a year earlier. Over the same period, operating cash flow increased from $81.8 billion to nearly $117 billion.
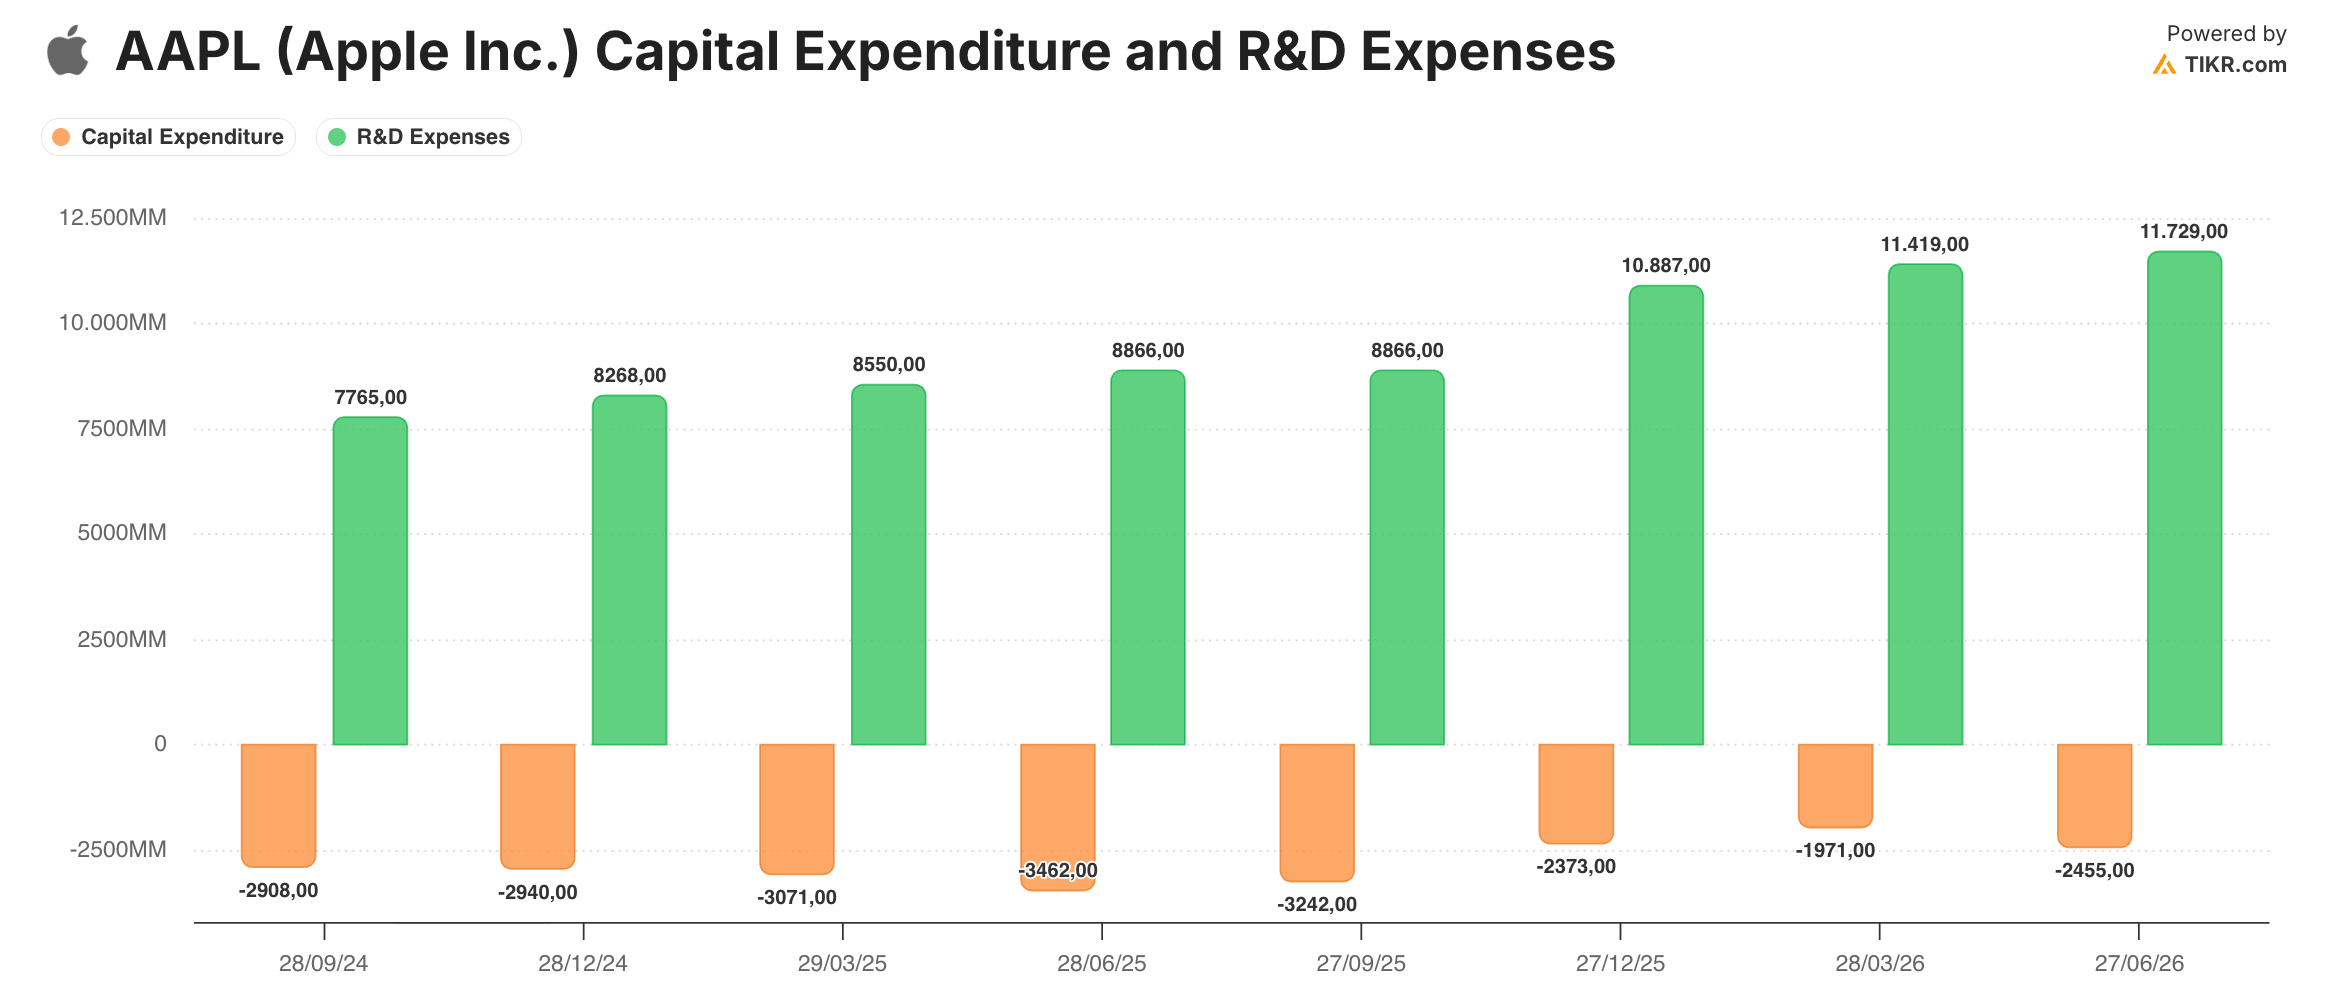
This does not mean that Apple is investing little in artificial intelligence. R&D spending increased 32% to $11.7 billion in the quarter, and the 10-Q attributes the increase primarily to higher infrastructure-related costs, including those associated with AI, as well as higher personnel expenses. In the first nine months of the fiscal year, R&D reached $34 billion, compared with $25.7 billion in the same period a year earlier.
Management also clarified why Apple’s model may remain less capital-intensive than that of the hyperscalers. Tim Cook explained that the company uses a hybrid model, combining its own data centers with third-party cloud infrastructure, while some workloads are processed directly on devices. Apple views the ability to perform part of the inference on-device as a strategic advantage because it reduces reliance on the cloud while strengthening privacy, speed, and hardware-software integration.
Siri AI will therefore be particularly important in understanding how this model evolves. Management acknowledged that it is still too early to estimate its compute costs precisely, but it has already pointed to one possible form of monetization: users who make more intensive use of AI features could be encouraged to move to higher-tier iCloud+ plans.
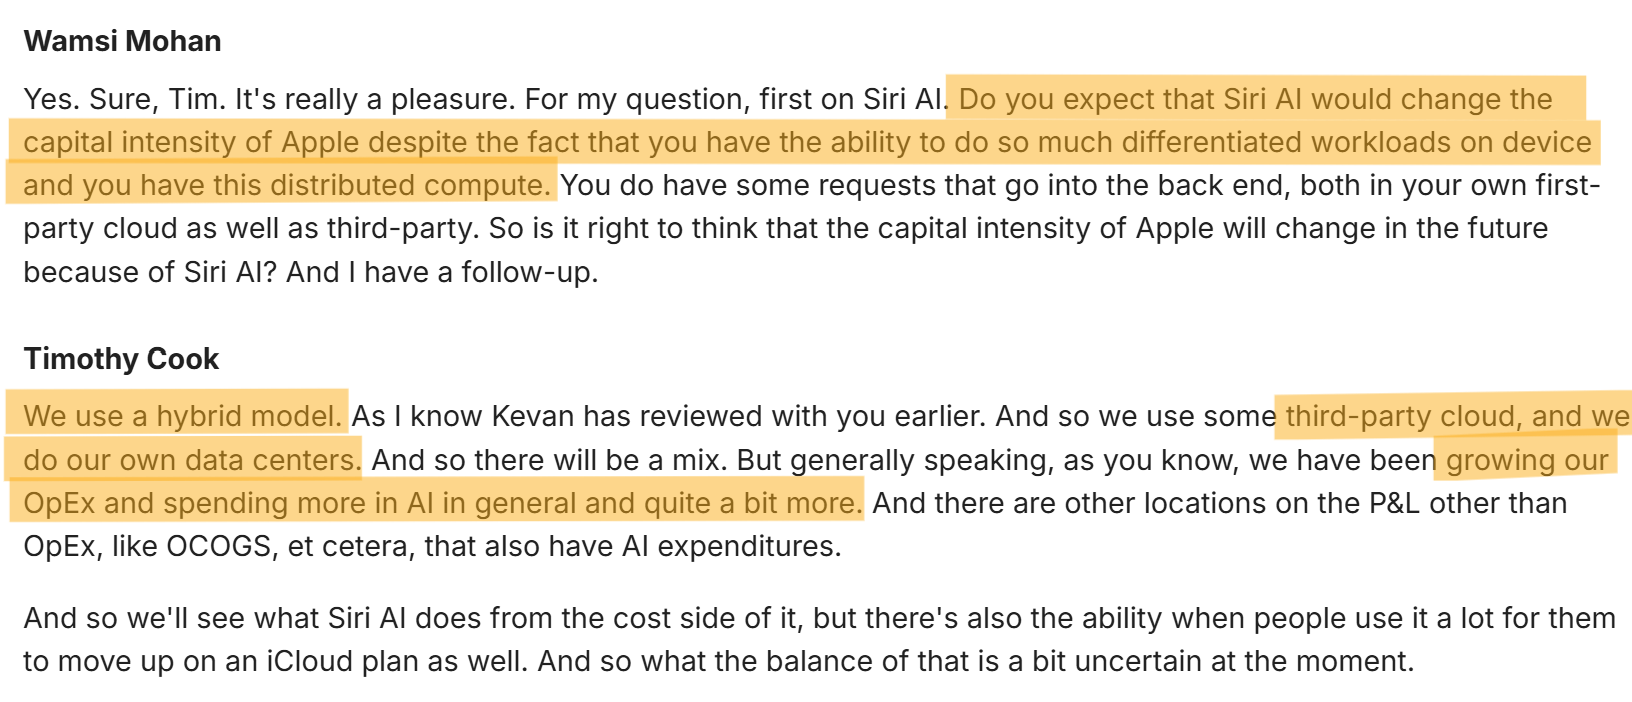
The difference versus Amazon or Microsoft is therefore substantial. Apple does not necessarily need to monetize AI by directly selling compute capacity to external customers. The objective may instead be to use artificial intelligence to increase the perceived value of the iPhone, accelerate replacement cycles, strengthen the ecosystem, and expand Services revenue over time.
For now, however, it is still too early to say that Siri AI is becoming a true driver of the hardware cycle. Management highlighted the very positive feedback received from the beta versions, but did not quantify any expected impact on iPhone sales. In addition, the rollout remains incomplete in some important markets: in Europe, Apple is still working with the Commission to make Siri AI available on iPhone and iPad, while in China only some initial Apple Intelligence features have been approved.
The current picture therefore remains one of an extremely strong operating business, supported by one of the strongest iPhone cycles in recent years, but with growth expected to slow in the near term due primarily to factors external to demand: supply constraints, foreign exchange, and memory cost inflation.
The negative reaction in the stock appears to reflect precisely this contrast. The market did not question the quality of the June quarter, but focused instead on slower expected growth and pressure on margins in the coming months. At the same time, the call suggests that the underlying picture is less weak than it may appear: demand for iPhone and Mac continues to exceed internal expectations and, at least for now, the problem is producing enough devices to meet that demand.
Over the medium term, however, the key variable will be AI. Unlike the hyperscalers, Apple is not yet putting free cash flow under pressure with hundreds of billions of dollars in CapEx: it is seeking to leverage its advantage in on-device processing and a hybrid infrastructure model to integrate AI directly into the product. If Siri AI succeeds in becoming a tangible point of differentiation for the iPhone while also supporting Services monetization, Apple could generate a meaningful return on AI without having to replicate the same capital intensity as its competitors.
All opinions and views expressed in this report constitute personal judgments as of the date of publication and are subject to change at any time without notice. There is no obligation to update or supplement the information contained herein. This content is provided solely for informational and educational purposes and does not constitute investment advice, an endorsement, or an offer or solicitation to buy or sell any financial instruments. Any ratings and target prices expressed represent personal estimates based on subjective analysis models and do not guarantee performance or provide any indication of future results. The information contained in this material is derived from sources believed to be reliable, but its accuracy, completeness, or timeliness is not guaranteed. It should not be relied upon as the primary basis for investment decisions and does not take into account the specific objectives, financial situation, or needs of any individual investor. Equity Analysis is not a registered investment advisor under applicable regulations. Investing involves risks, including the potential loss of all principal. Past performance is not indicative of future results. Equity Analysis disclaims any and all liability for any direct, indirect, or consequential losses or damages arising from the use of the information contained in this document.
👏👏👏